Short-term S&P 500 Outlook

Tunnel vision is almost always a risky approach to investing, however, this is one of those rare times where tunnel vision is actually the best way to go.

With tunnel vision I mean focusing on the (only) indicator that’s been working, and tuning out all other indicators.

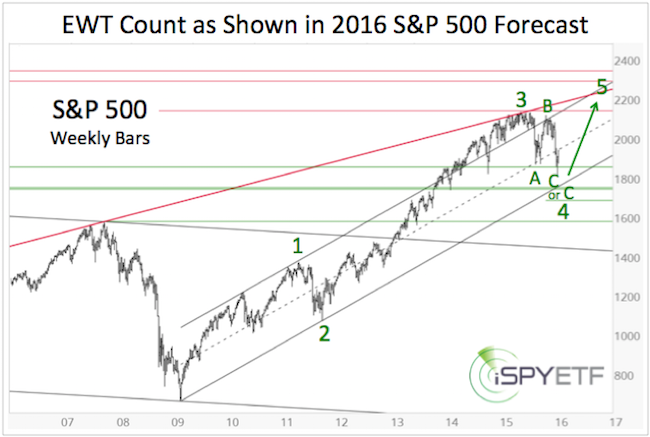
Elliott Wave Theory (EWT) has been the indicator deserving of investors’ focus. EWT (interpreted correctly) has persistently pointed to higher prices.

Months before the Trump rally, EWT strongly suggested a S&P 500 rally into the mid 2,300s and higher (original price projection was published here: S&P 500 Update – Expect the Abnormal).

Barron’s rates iSPYETF as “trader with a good track record” and Investor’s Bussines Daily says “When Simon says, the market listens.” Find out why Barron’s and IBD endorse Simon Maierhofer’s Profit Radar Report.

Short-term Outlook

The December 14, 2016 Profit Radar Report expected a prolonged period of sideways trading, and after over a month of ‘go nowhere’ action, the January 29 Profit Radar Report stated that:
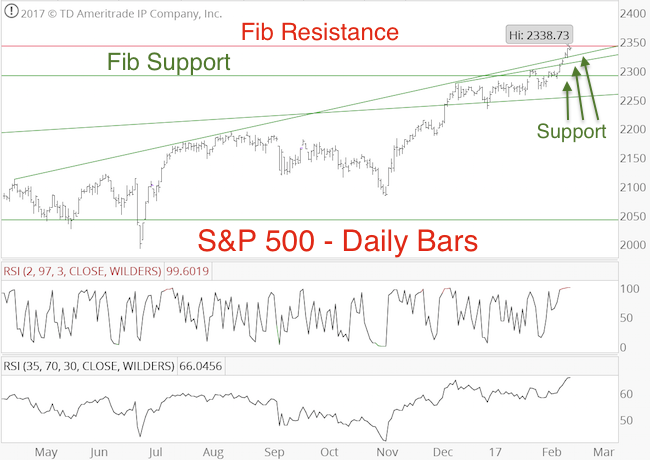
The sideways trading since Wednesday looks to be wave 4 with a possible down side target of 2,280 – 2,290 (open gap at 2,284.63). Based on the bearish divergences the S&P may peel lower, but based on EWT there’s a good chance the S&P will find support in the 2,280 – 2,290 range and rally into the low-mid 2,300s.”

We now know that EWT prevailed over bearish divergences and rallied into the EWT-based up side target mentioned in February 5 Profit Radar Report:

The S&P 500 moved above 2,290 on Friday. Measured EWT-based up side targets are in the 2,320 – 2,370 zone. Various bearish divergences (RSI-35, stocks above 50-day SMA) and near oversold condition still suggest some caution.”

No Can Do Tunnel Vision

To maintain a diversified research and forecasting approach, the Profit Radar Report looks at the most potent indicators and never relies solely on any one indicator.

Today’s push to new all-time highs erased (almost) all larger bearish divergences, and synchronizes EWT more with many other indicators (only cycles are short-term bearish).

The weight of evidence points to more strength ahead (2 steps forward, 1 step back, as outlined by the January 4 Profit Radar Report). Any pauses caused by overbought conditions or investors sentiment should be short-term in nature.

Next resistance (and chance for a pullback/pause) is around 2,342. Support is at 2,320, 2,300 and 2,285 (see chart).

At some point in 2017 however, we should see either a major market top or a 15% correction. More detail is available in the multiple-indicator based 2017 S&P 500 Forecast.

Popular S&P 500 ETFs include:

  • SPDR S&P 500 ETF (SPY)
  • iShares S&P 500 ETF (IVV)
  • Vanguard S&P 500 ETF (VOO)

Simon Maierhofer is the founder of iSPYETF and the publisher of the Profit Radar Report. Barron’s rated iSPYETF as a “trader with a good track record” (click here for Barron’s profile of the Profit Radar Report). The Profit Radar Report presents complex market analysis (S&P 500, Dow Jones, gold, silver, euro and bonds) in an easy format. Technical analysis, sentiment indicators, seasonal patterns and common sense are all wrapped up into two or more easy-to-read weekly updates. All Profit Radar Report recommendations resulted in a 59.51% net gain in 2013, 17.59% in 2014, and 24.52% in 2015.

Follow Simon on Twitter @ iSPYETF or sign up for the FREE iSPYETF Newsletter to get actionable ETF trade ideas delivered for free.

2017 Oil Forecast

Although volatile, 2016 was a good year for crude oil. The January 10, 2016 Profit Radar Report printed this outlook for 2016:

Sentiment is bearish (which should be positive for oil), but seasonality has a minor weak spot until early February. The overall setup for oil in 2016 looks positive, with a potential buy signal early February.”

Crude oil bottomed on February 11 at 26.05.

Barron’s rates iSPYETF as “trader with a good track record” and Investor’s Bussines Daily says “When Simon says, the market listens.”

For the second half of 2016 our indicators never really lined up to point in the same direction. There was no clear signal, which helps explains the choppy performance since the June high.

What are key indicators projecting for 2017?

Investor Sentiment

Commercial hedgers (the smart money) are betting on lower oil prices. In fact, hedgers are holding a record amount of short exposure.

The chart below was published in the January 11, 2017 Profit Radar Report. At the time, hedgers were short to the tune of 465,400 futures contracts (this has increased to 509, 138).

Nevertheless, the January 11, 2017 Profit Radar Report stated that: “As long as trade stays above 48 – 50, we will allow for higher prices.” Why?

Seasonality

Oil is one of those commodities with a very distinct seasonal pattern. Seasonality turns strongly bullish in February.

Tiebreaker: Technical Analysis

Investor sentiment suggests risk is rising while seasonality should buoy prices.

How do we reconcile this conflict between sentiment and seasonality?

Such conflicts often cause stalemates or relative trading ranges.

Based on Elliott Wave Theory, oil appears to be in a wave 4 rally (which retraces part of the 2014 – 2016 drop from 107 to 26.

Ideally wave 4 will extend higher (towards 60) before falling towards and below 26 in wave 5.

Here are the most liquid oil ETPs (Exchange Traded Products):

United States Oil Fund (USO)
iPath S&P GSCI Crude Oil ETN (OIL)

ProShares UltraShort Bloomberg Crude Oil ETF (SCO)
VelocityShares 3x Inverse Crude Oil ETN (DWTI)

Continued updates and trade recommendations will be available via the Profit Radar Report.

Simon Maierhofer is the founder of iSPYETF and the publisher of the Profit Radar Report. Barron’s rated iSPYETF as a “trader with a good track record” (click here for Barron’s profile of the Profit Radar Report). The Profit Radar Report presents complex market analysis (S&P 500, Dow Jones, gold, silver, euro and bonds) in an easy format. Technical analysis, sentiment indicators, seasonal patterns and common sense are all wrapped up into two or more easy-to-read weekly updates. All Profit Radar Report recommendations resulted in a 59.51% net gain in 2013, 17.59% in 2014, and 24.52% in 2015.

Follow Simon on Twitter @ iSPYETF or sign up for the FREE iSPYETF Newsletter to get actionable ETF trade ideas delivered for free.

Profit Radar Report’s 2017 S&P 500 Forecast

The full year S&P 500 forecast is my biggest project of the year, and quite frankly it’s kind of a thankless job. Why? It gives every critic a documented, black and white foundation for criticism.

It is impossible to predict a full year of stock market future, that’s why market forecasts are loaded with ‘ifs,’ “buts,’ and other ambiguities. Anyone attempting to predict the unpredictable is doomed to miss the mark.

That would explain why no other newsletter (at least not that I’m aware of) publishes an actual full year S&P 500 chart projection (2016 projection shown below). Accountability is an underrated (if not entirely ignored) concept on Wall Street. But what’s the purpose of following many time-tested indicators if we don’t put them to work?

Subscribers to the Profit Radar Report deserve a straight-forward forecast. My goal is to provide a rough roadmap for the year ahead, based on what indicators are telling us right now.

Before we get to the 2017 S&P 500 Forecast, here is a review of the 2016 S&P 500 Forecast, published on January 31, 2016.

2016 S&P 500 Forecast Review

Below is a review (and small excerpt) of our 2016 S&P 500 Forecast, based on four key indicators (supply & demand, technical analysis, investor sentiment, seasonality and cycles). Each indicator/forecast is graded with a green pass, red fail or red/green draw symbol.

At the time of publishing (January 31, 2016), our bullish 2016 outlook was truly contrarian.

A more detailed version of the 2016 S&P 500 Forecast was published here.

2017 S&P 500 Forecast

It wouldn’t be fair to re-publish analysis paid for by subscribers here for free, but I feel comfortable sharing a few key points.

The 2016 S&P 500 Forecast featured this Elliott Wave Theory based forecast, which pointed to new all-time highs with a target around 2,290.

Our major market top indicator confirmed the most recent S&P 500 highs. This means a major market top is, at minimum, months away.

The up side target has been adjusted accordingly. In fact, the 2017 S&P 500 Forecast expounds on a more bullish Elliott Wave interpretation (which was first discussed in the August 28 Profit Radar Report).

We will crosscheck the S&P 500 future S&P 500 pattern against our major market top indicators and investor sentiment (the 2017 S&P 500 Forecast includes a sentiment comparison between 2007 and 2017) to determine whether upcoming all-time highs will be a major top or not.

Beware of 15% Correction!

Despite the bullish potential, and even if this bull market has (much) further to go, the S&P 500 is likely to suffer a 15% correction in 2017.

Why and when, and much more detail, is revealed in the Profit Radar Report’s 2017 S&P 500 Forecast

Simon Maierhofer is the founder of iSPYETF and the publisher of the Profit Radar Report. Barron’s rated iSPYETF as a “trader with a good track record” (click here for Barron’s profile of the Profit Radar Report). The Profit Radar Report presents complex market analysis (S&P 500, Dow Jones, gold, silver, euro and bonds) in an easy format. Technical analysis, sentiment indicators, seasonal patterns and common sense are all wrapped up into two or more easy-to-read weekly updates. All Profit Radar Report recommendations resulted in a 59.51% net gain in 2013, 17.59% in 2014, and 24.52% in 2015.

Follow Simon on Twitter @ iSPYETF or sign up for the FREE iSPYETF Newsletter to get actionable ETF trade ideas delivered for free.