Subscribers to iSPYETF’s free e-mail newsletter receive a market outlook, usually once a week. The market outlook below was sent out on January 26, 2022. If you’d like to sign up for the free e-newsletter, you may do so here (we will never share your e-mail with anyone, just as we don’t accept advertising).
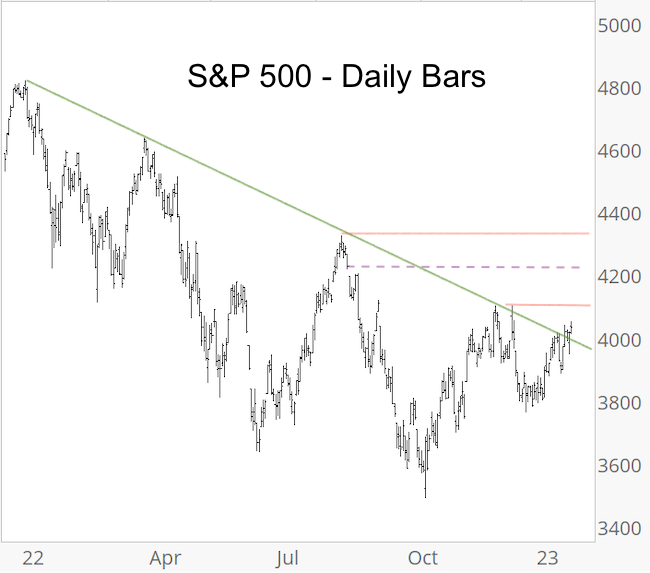
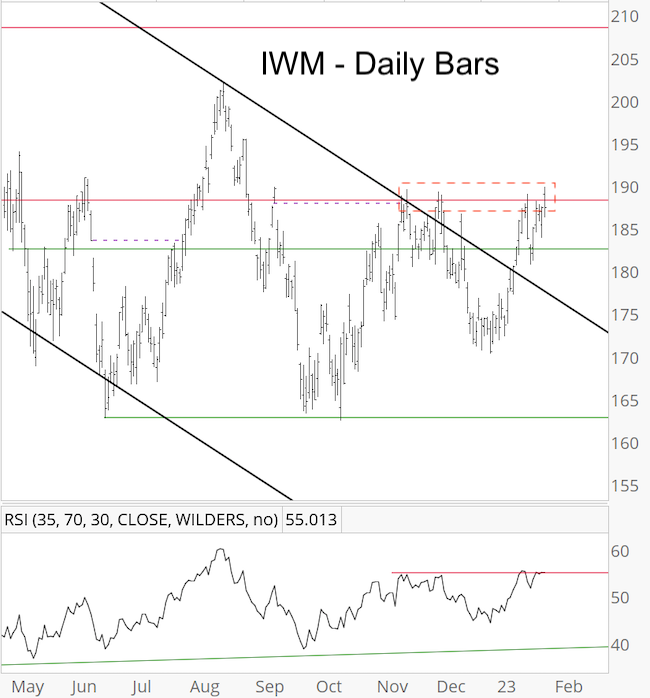
Stock market bears are getting squeezed again this week as the S&P 500 grinds higher. And, for the first time in a year, the S&P closed above the descending trend line. The color of that trend line is now green, because it’s support. As long as this support holds, price can continue higher.
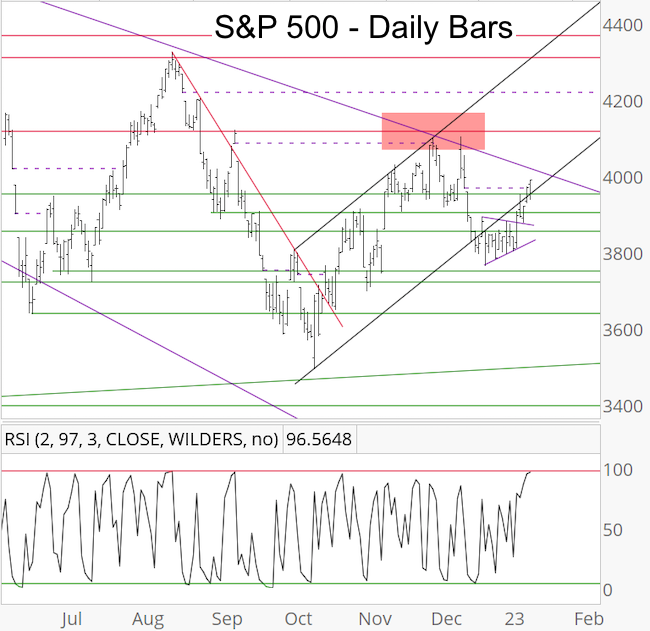
This week’s push above last week’s high eliminated the most bearish of Elliott Wave patterns (a nested wave 3 decline proclaimed by a number of Elliotticians). The red lines show other highs. Every time one of those highs is eclipsed, bears’ hopes sink.
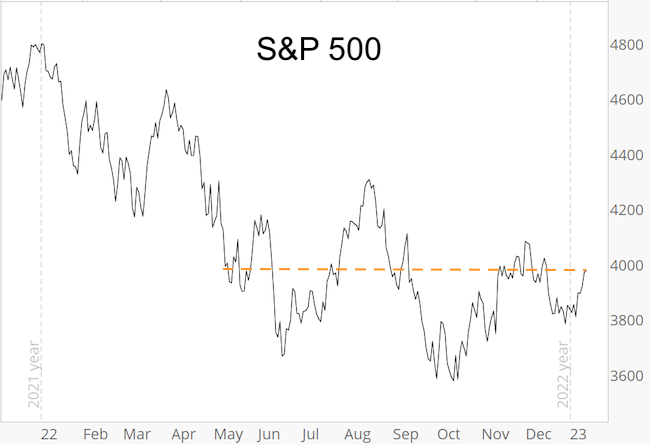
Perhaps more important is the dashed purple line. It’s an open chart gap left by the 9/13/22 drop. Ever since then I’ve been talking about that chart gap being closed (most recently here: 2023 S&P 500 Forecast).
Unlike the S&P, the recent IWM peaks are all clustered in the 189.50 neighborhood. IWM needs to break above this zone – confirmed by RSI-35 – to allow the S&P to move higher as well. Without IWMs support, risk of a pullback remains present.
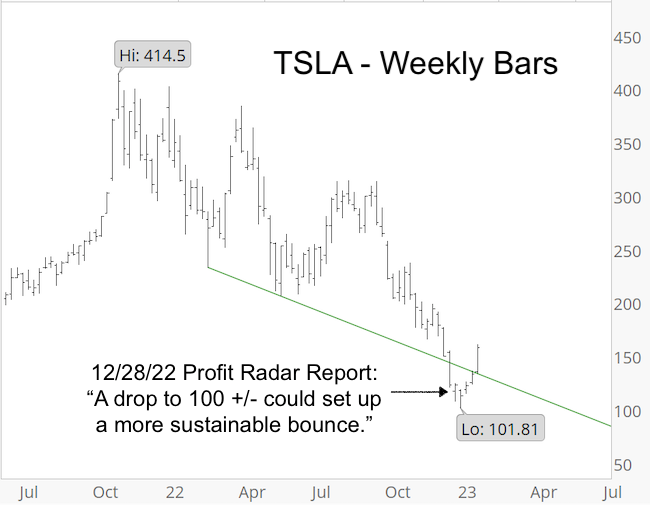
I stated in the December 28 Profit Radar Report that: “TSLA has been in crash mode, with the December meltdown likely being part of a wave 3. The long-term chart shows there’s no significant support near current price. Perhaps a temporary bounce and eventual drop to 100 +/- could set up a more sustainable bounce.”
Shortly thereafter, TSLA fell as low as 101.81 and is up over 50% since. While this bounce could be only a wave 4, it’s likely a larger degree bounce with higher targets (as long as price stays above the green support line).
2023 S&P 500 Forecast
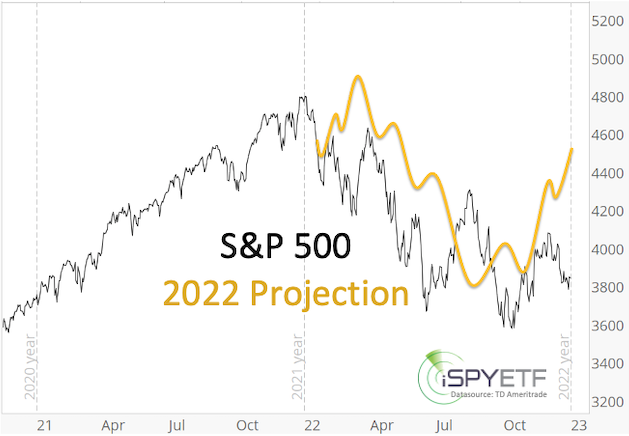
This is the time of year where I’m working on the full year S&P 500 Forecast. This forecast includes the most pertinent facts and indicators and an actual price projection based on those indicators.
The proof is in the pudding and the chart below plots my 2022 S&P 500 projection (yellow line) against the actual price action (you can see the original projection at the bottom of this page).
The full S&P 500 Forecast is available here for your review.
Below are some of the warning signs mentioned in the 2022 S&P 500 Forecast BEFORE the stock market fell into a pothole:
– “The bearish divergence (NY Composite a/d lines) reappeared again at the January 2022 S&P 500 highs. This internal market deterioration is a concern and a warning sign.”
– “The 6-month average of Titanic signals exceeded 25. It’s been a good bear market indicator. Although the majority of breadth studies are positive, this is one that should not be ignored.”
– “We’ll focus on the commonality of all 3 (Elliott Wave Theory) scenarios: Up side is limited and down side risk is increasing.”
– “Trend line resistance is around 4,915. We do not expect the S&P to break above this trend line in 2022.”
– “Short-term, the January 10, 2022 low at 4,582 is important. Failure to hold above this level would be a warning signal with the potential for a quick drop into the 4,200 – 4,300 range. If the 4,200 – 4,300 support zone fails, a test of the 4,000 zone (as low as 3,700) is possible.”
– “2022 is the mid election year, which is the weakest of the 4-year presidential election year cycle. Historically (going back to 1950), the S&P 500 declines on average about 20% into the mid-term election year low.”
– “Since the Fed is planning to unwind and reduce purchases (and shrink its balance sheet) in 2022, the risk of a more serious correction this year is much greater than in 2021.”
To receive the 2023 S&P 500 Forecast and for continued updates and purely fact based research, sign up for the Profit Radar Report.
The Profit Radar Report comes with a 30-day money back guarantee, but fair warning: 90% of users stay on beyond 30 days.
Barron’s rates iSPYETF a “trader with a good track record,” and Investor’s Business Daily writes “Simon says and the market is playing along.”tock