S&P 500 Update

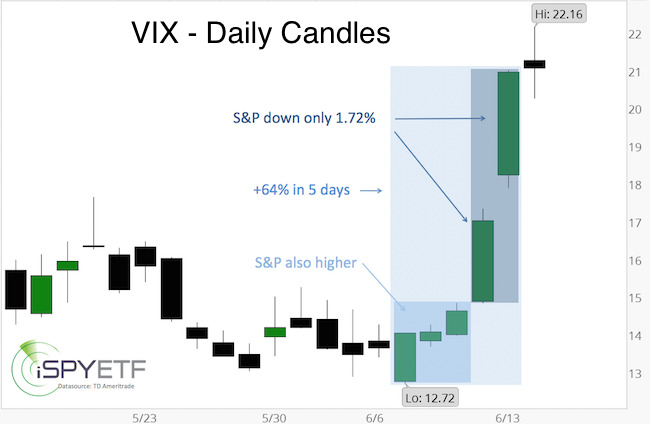
A lot has happened the last week or two, and it appears like the S&P 500 has entered the ‘post panic’ stage. Before we discuss the typical ‘post panic’ pattern, here is a brief recap.

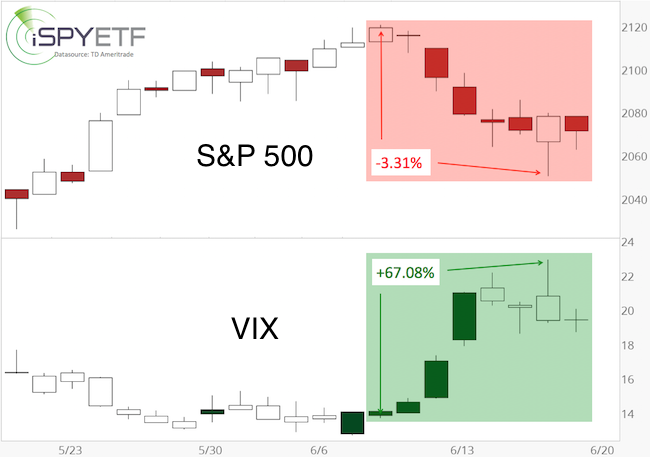
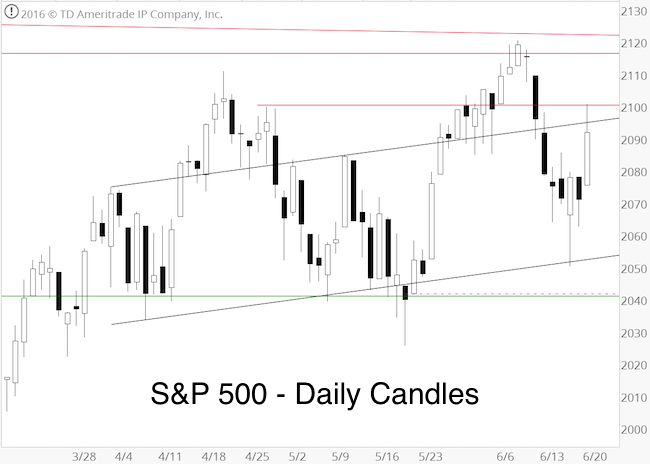
On June 9, we went short the S&P 500 at 2,110. This was our insurance trade against lower prices (unlike an actual insurance policy, this trade didn’t cost anything).

On June 19, which was five days before the Brexit vote, the Profit Radar Report was looking for “an early week bounce, followed by a late week sell off,” which is pretty much what happened.

Barron’s rates iSPYETF as a “trader with a good track record.” Click here for Barron’s assessment of the Profit Radar Report.

Somewhere in between the bounce and sell off is an interesting tale about what happened to our short position. This tale is told here.

The question, after the S&P lost 122 points in three days, is: What’s next?

What’s Next?

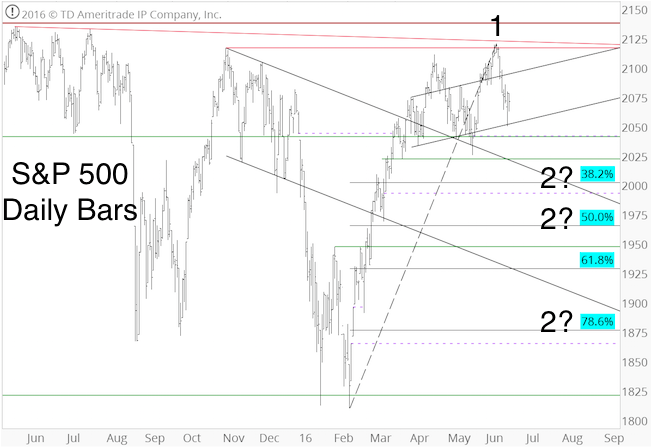
The chart below, initially published by the June 19 Profit Radar Report, along with the following commentary, may have the answer:
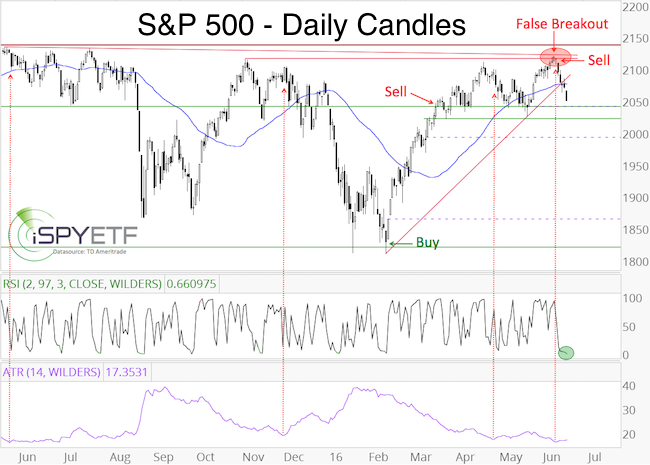
Based on Elliott Wave Theory, the S&P finished 5-waves up to complete wave 1 on June 8 at 2,120.55. Next should be a wave 2 decline. Waves 2 tend to retrace a Fibonacci 50% – 61.8% of the prior move. The ideal target range for a wave 2 correction is 1,970 – 1,925.”

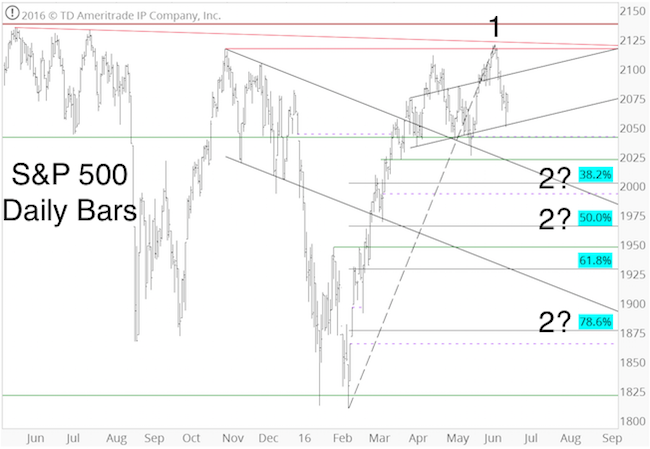
The S&P 500 has not reached the ideal target zone, but odds are decent it will (eventually).

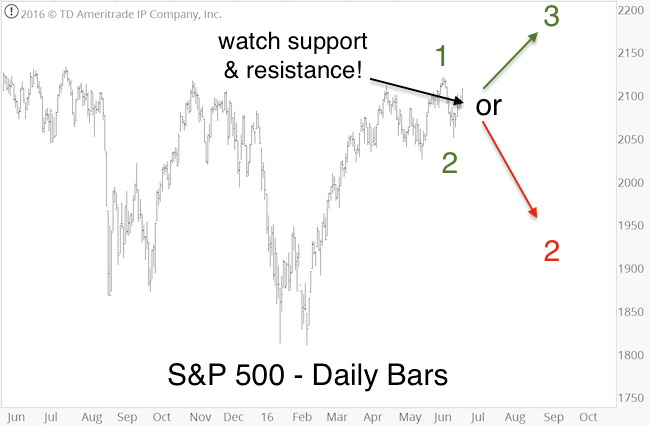
The June 27 Profit Radar Report painted the following picture: “Two separate price patterns suggest a bounce is brewing. Today’s decline didn’t hit any specific support level, but it closed the open chart gap at 1,992.63. The panic decline is nearing its end. Next should be a choppy bounce.”

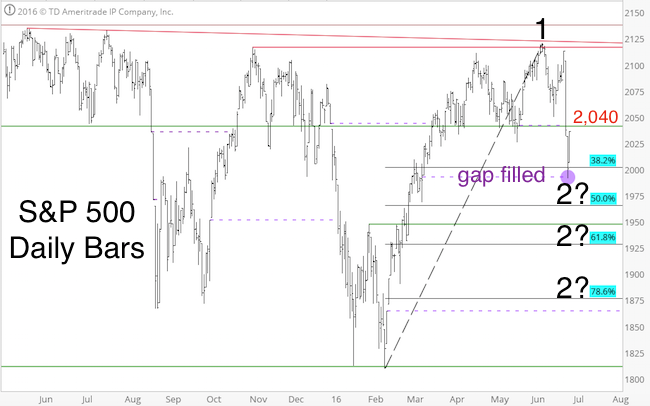
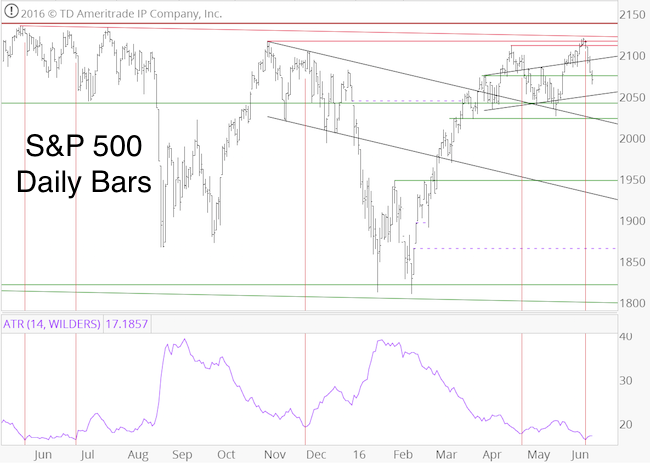
It appears like the S&P is now tracing out this ‘choppy bounce.’ Tuesday’s strong surge brought the S&P 500 almost back to 2,040, which was prior support, and is now resistance.

Normally we’d say that a move above 2,040 would unlock further up side (and it probably will), but post panic moves tend to be choppy and unpredictable, likely to seesaw across support/resistance levels.

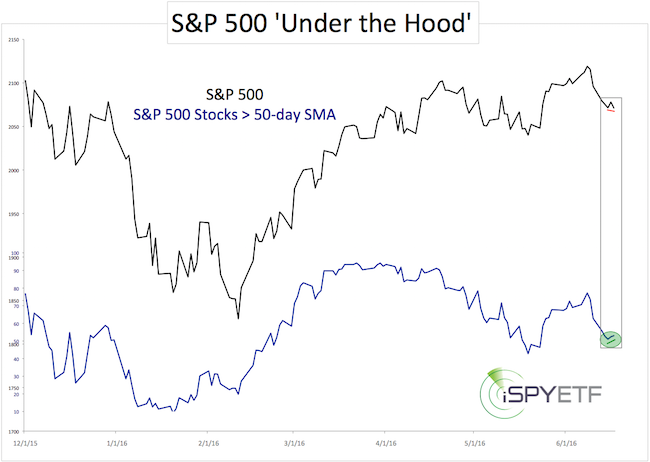
While the daily price action may become irrational, the Profit Radar Report identified a post panic pattern the S&P adheres to about 7 of 10 times. We discussed this pattern after the initial January panic decline here … and it ultimately helped us to buy on February 11 at S&P 1,828.

Most indicators thus far suggest this post panic pattern will be one of the 7. The latest Profit Radar Report update outlines this specific pattern. Of course, we never completely rely on any particular patterns, but use our indicators to either confirm or invalidate, and adjust accordingly. Continued updates are available via the Profit Radar Report.

Simon Maierhofer is the founder of iSPYETF and the publisher of the Profit Radar Report. Barron’s rated iSPYETF as a “trader with a good track record” (click here for Barron’s profile of the Profit Radar Report). The Profit Radar Report presents complex market analysis (S&P 500, Dow Jones, gold, silver, euro and bonds) in an easy format. Technical analysis, sentiment indicators, seasonal patterns and common sense are all wrapped up into two or more easy-to-read weekly updates. All Profit Radar Report recommendations resulted in a 59.51% net gain in 2013, 17.59% in 2014, and 24.52% in 2015.

Follow Simon on Twitter @ iSPYETF or sign up for the FREE iSPYETF Newsletter to get actionable ETF trade ideas delivered for free.


My Worst ‘Mistake’ of the Year

Allow me to tell the painful tale of a perfectly timed short S&P 500 trade. This is a classic example of where doing what is right feels so wrong.

The Short Entry

Via the June 8, Profit Radar Report, I recommended to short the S&P 500. We called this the most promising setup since we bought the S&P at 1,828 on February 11.

Barron’s rates iSPYETF as a “trader with a good track record.” Click here for Barron’s assessment of the Profit Radar Report.

The short entry turned out to be perfectly timed as the market sold off right afterwards.

Ignoring Brexit

Unlike many pundits and analysts, I didn’t participate in the Brexit/Bremain speculation. Why? Trying to predict the unpredictable is a fool’s errand, as the headlines below show:

  • MarketWatch: Bollinger Bands Suggest Stocks Could Break Out in a Big Way
  • Wall Street Journal: U.S. Stocks Rally as Markets Bet on ‘Bremain’
  • Forbes: Stocks Rally with Brexit Looking Unlikely
  • MarketWatch: Stocks close higher as Wall Street bets U.K. Will Vote to Stay in EU

The market proved the above headlines wrong just one day after they were written.

Indictor Toolbox Correctly Foresees Brexit Reaction

In hindsight, it becomes clear that our indicators accurately predicted what was to happen last week (the week of the Brexit vote). Here is outlook published via the June 19 Profit Radar Report:

In terms of seasonality, the week after June Triple Witching has been dismal, down 10 of the past 11 years. Based on Elliott Wave Theor,y the S&P finished 5-waves up to complete wave 1 on June 8 at 2,120.55. Next should be a wave 2 decline. Waves 2 tend to retrace a Fibonacci 50% – 61.8% of the prior move. The ideal target range for a wave 2 correction is 1,970 – 1,925.

However, prior to resuming the down trend, the S&P may bounce to 2,090 – 2,110. It would take a move above 2,121 to unlock a much more bullish wave structure.

Summary: The positive market breadth divergence at Friday’s close suggests the market wants to bounce. Similar bouts of selling in the past have usually led to relief rallies. However, seasonality is bearish for next week. Perhaps we will get a little of both, an early week bounce to 2,090 – 2,110, followed by a late week sell off.”

The chart below (published along with the June 19 Profit Radar Report) highlights the mentioned down side targets.

As it turns out, the market followed the ‘script’ almost perfectly. It rallied the first part of the week, and sold of the last part of the week. However, … there was one big problem.

Only Mention of Brexit

The first and only time the Profit Radar Report mentioned the Brexit vote was on June 22, when it provided a timelime for when the UK vote results would be released.

In short, vote results would be available Friday around 7am GMT, which is 3am EST, which means Wall Street would be closed and subject to massive gap up or down open.

That was the biggest risk for investors and our S&P 500 short position.

The June 12 Profit Radar Report warned of this risk (in correlation with out short position) as follows:

Our biggest worry is finding the best stop-loss level. The S&P is already nearing an oversold condition as it’s approaching the first support zone, which increases the odds of a bounce. Based on the open chart gaps, a bounce above 2,110 (our entry level is possible).

Worst-case scenario (assuming a stop-loss at 2,110) would be a bounce above 2,110, followed by another leg lower. Based on Elliott Wave Theory, that’ possible. However, raising the stop-loss would increase risk.”

On Wednesday before the vote, two VIX-based indicators registered sentiment extremes that have led to rallies on the past.

On Thursday before the vote, the S&P 500 moved above 2,110. This stopped us out of our short S&P 500 position at breakeven … at the worst possible time.

The next day, the S&P gapped lower and dropped to 2,054 within the first hour of trading. Unfortunately we weren’t on that bus.

Better Safe than Sorry

A couple of decades of managing other’s people money have taught me to always err on the side of caution. Although much of the evidence suggested a resolution to the down side, holding on to the short position overnight would have been closer to gambling than prudent risk management.

Due to the time difference between the UK and the US, and the associated gap up or gap down open, prudent risk management was impossible. Although we’d love to have made money of the post-Brexit meltdown, fortunately the worst-case scenario for us is to be out of the market while many other investors are suffering a big hit on their portfolio.

Still, never has doing the right (the prudent) thing felt so wrong.

Continued S&P 500 analysis is available via the Profit Radar Report.

Simon Maierhofer is the founder of iSPYETF and the publisher of the Profit Radar Report. Barron’s rated iSPYETF as a “trader with a good track record” (click here for Barron’s profile of the Profit Radar Report). The Profit Radar Report presents complex market analysis (S&P 500, Dow Jones, gold, silver, euro and bonds) in an easy format. Technical analysis, sentiment indicators, seasonal patterns and common sense are all wrapped up into two or more easy-to-read weekly updates. All Profit Radar Report recommendations resulted in a 59.51% net gain in 2013, 17.59% in 2014, and 24.52% in 2015.

Follow Simon on Twitter @ iSPYETF or sign up for the FREE iSPYETF Newsletter to get actionable ETF trade ideas delivered for free.

If you enjoy quality, hand-crafted research, >> Sign up for the FREE iSPYETF Newsletter

3 Must Know Brexit Vote Facts

Up until now, iSPYETF did not participate in the Brexit discussion. Why? Until the votes are cast and counted, it’s all speculation. We can’t predict the outcome of the vote and how the market reacts.

The best thing we can do is look at our dashboard of indicators and decipher their message. Based on our indicators, the Profit Radar Report anticipated a pullback in early June, but stated on June 15 that: “Following five consecutive down days, the S&P is compressed and prone to bounce. Based on Elliott Wave Theory, this bounce should stop at 2,090 – 2,110.”

We are right at 2,110, just a few hours before Britain heads to the polls.

As the vote is imminent, there are three absolute must know facts:

  1. Timing
  2. Bullish/Bearish VIX Pattern
  3. S&P 500 Coiling Pattern

1) Timing

According to the BBC, polls will close on Thursday at 22:00 GMT (3:00pm PST, 6:00pm EST). The ballot count is expected to start as soon as the polling stations close. Credit Suisse estimates that about 25% of the votes will be counted by 3:00am GMT (8:00pm PST, 11:00pm EST), 50% of the votes will be counted by 4:00am GMT (9:00pm PST, 12:00am EST).

There will be a rolling total so the time at which one side reaches the point of being mathematically unbeatable depends on how quickly the vote are counted and how close the results are running. Some expect the final result on Friday around 7:00am GMT (12:00am PST, 3:00am EST).

In other words, Wall Street will likely be closed when the results come in. This may well result in a gap up or gap down open on Friday morning. Risk adverse investors who don’t want any voting-related risk, should close out positions before the end of close today.

2) Bullish/Bearish VIX Pattern

There are three different volatility indexes:

  1. CBOE Short-term Volatility Index (VXST): Expectations of 9-day volatility
  2. CBOE Volatility Index (VIX): Expectation of 30-day future volatility
  3. CBOE 3-Month Volatility Index (VXV): Expectation of 3-month volatility

Looking at the volatility correlation between various time frames can provide helpful clues.

For example, the expectation of increased short-term volatility relative to long-term volatility (VIX/VXV ratio above 1, or VXST/VIX ratio above 1.2) is usually a contrarian indicator. When investors brace themselves for more immediate volatility, the opposite tends to happen and stocks move higher. Investors are bracing themselves right now.

The first chart plots the S&P 500 against the VXST/VIX and VIX/VXV ratio. Short-term volatility is elevated relative to longer-term volatility.

The VXST/VIX ratio is at 1.31. The dashed green lines show that similar readings in the past coincided with market lows. The VIX/VXV ratio is at 1, which is elevated as well.

However, VIX seasonality is nearing the best buy signal of the year.

S&P 500 Coiling Pattern

Based on Elliott Wave Theory, the S&P 500 is at or near a significant inflection point (fork in the road).

Summary

According to the charts, stocks are at or near an important inflection point, and the Brexit vote may be the catalyst for the next move.

The market could break into either direction. Now is the time to watch important support/resistance levels. Trade above resistance is likely to send stocks significantly higher, while a drop below support should lead to a sizeable correction.

Continued S&P 500 analysis is available via the Profit Radar Report.

Simon Maierhofer is the founder of iSPYETF and the publisher of the Profit Radar Report. Barron’s rated iSPYETF as a “trader with a good track record” (click here for Barron’s profile of the Profit Radar Report). The Profit Radar Report presents complex market analysis (S&P 500, Dow Jones, gold, silver, euro and bonds) in an easy format. Technical analysis, sentiment indicators, seasonal patterns and common sense are all wrapped up into two or more easy-to-read weekly updates. All Profit Radar Report recommendations resulted in a 59.51% net gain in 2013, 17.59% in 2014, and 24.52% in 2015.

Follow Simon on Twitter @ iSPYETF or sign up for the FREE iSPYETF Newsletter to get actionable ETF trade ideas delivered for free.


S&P 500 Dead Cat Bounce or New Up Trend

The S&P 500 is enjoying its largest 1-day pop since May 24. Is this a dead cat bounce or the beginning of a new up trend?

Cause and Effect

What caused this bounce will help us figure out whether it has legs.

Monday’s pop comes on the heels of an interesting losing streak. The S&P was down 6 of the prior 7 days, but lost only a relatively tame 3.31%.

There was nothing tame about the VIX’s reaction however, spiking as much as 67.08% (see chart below).

On June 8 (when the S&P closed at 2,119), the Profit Radar Report recommended to short the S&P 500 once it drops below 2,110 with the following reasoning:

At this point, we can’t quantify the maximum down side risk, but we know there’s potential for a deeper pullback once this rally is complete. We want to have some skin in the game should there be a sizeable decline. This is an insurance trade against missing out. We will go short if the S&P 500 drops below 2,110.”

Barron’s rates iSPYETF as a “trader with a good track record.” Click here for Barron’s assessment of the Profit Radar Report.

We termed this the FOMO insurance trade. What is a FOMO insurance trade? FOMO stands for ‘fear of missing out.’ Having insurance allowed us to watch the S&P losing streak knowing that we’ll make money as the market drops (and if it continues to fall).

If you enjoy quality, hand-crafted research, >> Sign up for the FREE iSPYETF Newsletter

Insurance usually comes at a price. However, with our stop-loss at break even, our insurance came free and offered the mental peace only a well-timed entry can provide.

On June 15 however, the Profit Radar Report warned of an impending bounce and stated:

Following five consecutive down days, the S&P is compressed and prone to bounce. Based on Elliott Wave Theory, this bounce should stop at 2,090 – 2,110 and relapse to new lows. Trade above 2,110 (and especially 2,121) would unlock much more bullish options. Investors that prefer to lock in a small paper gain rather than holding out for a potentially bigger gain may close out the S&P short position.”

At Friday’s close, the S&P 500 carved out a bullish divergence (see chart below – published via the June 19 Profit Radar Report).

This bullish divergence combined with an oversold condition caused Monday’s bounce.

Thus far, the S&P remains in the 2,090 – 2,110 target/reversal zone. Bearish post Triple Witching week seasonality suggests this is just a dead cat bounce.

It would take a move above 2,121 to ‘resurrect the dead cat.’

Continued S&P 500 analysis is available via the Profit Radar Report.

Simon Maierhofer is the founder of iSPYETF and the publisher of the Profit Radar Report. Barron’s rated iSPYETF as a “trader with a good track record” (click here for Barron’s profile of the Profit Radar Report). The Profit Radar Report presents complex market analysis (S&P 500, Dow Jones, gold, silver, euro and bonds) in an easy format. Technical analysis, sentiment indicators, seasonal patterns and common sense are all wrapped up into two or more easy-to-read weekly updates. All Profit Radar Report recommendations resulted in a 59.51% net gain in 2013, 17.59% in 2014, and 24.52% in 2015.

Follow Simon on Twitter @ iSPYETF or sign up for the FREE iSPYETF Newsletter to get actionable ETF trade ideas delivered for free.

If you enjoy quality, hand-crafted research, >> Sign up for the FREE iSPYETF Newsletter

The Most Promising S&P 500 Setup Since February 11 (when it was at 1,810)

In terms of actual trading recommendations, 2016 has been a fairly quite year for the Profit Radar Report. We’ve had only seven actual trade recommendations (only one losing trade).

Barron’s rates iSPYETF as a “trader with a good track record.” Click here for Barron’s assessment of the Profit Radar Report.

Until last week, the only stock-related trade was the S&P 500 buy at 1,828 on February 11 (closed on March 17 for a 11.6% gain).

Based on hindsight, not trading the choppy range from March 20 to June 8 has been the right decision.

Stalking Pays Off

Starting on May 24, the Profit Radar Report was looking for a false S&P 500 breakout and subsequent reversal.

After stalking the S&P 500 for two weeks for a low-risk entry, our carefully selected short trigger was met at 2,110 on June 9 (click here for more details on how we ‘stalked’ the S&P and avoided shorting prematurely). The corresponding ETF trade was to buy the ProShares Short S&P 500 ETF (SH) at 19.80.

This became the first S&P 500 trade since February 11, 2016. What’s special about this trade?

The FOMO (Fear of Missing Out) Trade

The chart below (published in the June 8 Profit Radar Report) shows that the ATR (average true range) dropped to the lowest level since June 29, 2015. ATR is a measure of volatility, and it showed a dangerous level of complacency (dotted red arrows).

As the horizontal red lines indicate, there was a cluster of resistance levels at 2,110 – 2,139. There was also an obvious bearish divergence on the hourly chart (not shown).

In short, the S&P was ripe for a reversal in a strong resistance range. The ingredients for a pullback where in place. The fact that the S&P 500 was near its all-time high (which means considerable down side potential) added to the intrigue.

Therefore, the June 8 Profit Radar Report stated the following:

At this point, we can’t quantify the maximum down side risk, but we know there’s potential for a deeper pullback once this rally is complete. We are attempting to carefully short so we have some skin in the game should there be a sizeable decline. This is an insurance trade against missing outWe will go short if the S&P 500 drops below 2,110.”

The decline since the June 8 high has been kind of odd. The S&P 500 has been down for six consecutive days, the VIX went soaring (click here for recent VIX anomalies), but the S&P loss has been relatively small (2.8%).

At this point, the S&P is oversold, by may have entered a powerful wave 3 down (according to Elliott Wave Theory). There are a number of open chart gaps, which suggest that the S&P will recover once this correction is done.

Continued S&P 500 analysis is available via the Profit Radar Report.

Simon Maierhofer is the founder of iSPYETF and the publisher of the Profit Radar Report. Barron’s rated iSPYETF as a “trader with a good track record” (click here for Barron’s profile of the Profit Radar Report). The Profit Radar Report presents complex market analysis (S&P 500, Dow Jones, gold, silver, euro and bonds) in an easy format. Technical analysis, sentiment indicators, seasonal patterns and common sense are all wrapped up into two or more easy-to-read weekly updates. All Profit Radar Report recommendations resulted in a 59.51% net gain in 2013, 17.59% in 2014, and 24.52% in 2015.

Follow Simon on Twitter @ iSPYETF or sign up for the FREE iSPYETF Newsletter to get actionable ETF trade ideas delivered for free.


VIX Spikes 64% in 5 Days – What Does this Mean?

The recent VIX behavior has been unprecedented.

  • The VIX gained 64% from June 14 – June 20.
  • The VIX gained 41% on June 10 and June 13, while the S&P only lost 1.72%.
  • On June 7, 8, 9, the VIX moved higher along with the S&P 500.

What does this mean?

While the scope of the VIX spike is unprecedented, a higher VIX was to be expected.

The June 8 Profit Radar Report (S&P 500 closed at 2,119 that day) published the chart below along with the following warning:

Volatility, as measured by the average true range (ATR), has dropped to the lowest level since June 29, 2015. The chart shows that low ATR, a sign of complacency, tends to be negative for stocks. We will go short the S&P 500 if it drops below 2,110.”

Barron’s rates the iSPYETF’s Profit Radar Report as a “trader with a good track record.” Click here for Barron’s assessment of the Profit Radar Report.

The next day, the S&P started falling and the VIX starting soaring. On Friday June 10, the VIX spiked 16.33% despite a subdued S&P 500 loss of only 0.92%.

The VIX Spike in Historical Context

What does this discrepancy between VIX and S&P mean? The June 12 Profit Radar Report featured the following analysis:

Despite a somewhat subdued S&P loss of ‘only’ 0.92%, the VIX spiked 16.33%. This appears excessive, but those kneejerk reactions have almost become the norm as the bull market nears maturity and investors are afraid every decline is the ‘big one.’

The chart (updated chart shown below) plots the S&P 500 against the VIX. The lower panel shows S&P 500 losses and corresponding VIX gains. The dotted red boxes highlight various declines since the beginning of 2014.

The numbers above the red boxes reflect the ratio between VIX gains and S&P losses (i.e. Friday: VIX of 16.33 divided by S&P gain of 0.92 = 17.79) recorded during the first few days of the decline.

Based on this comparison, Friday’s VIX spike, although a potential over reaction, is not necessarily above the norm.”

On the next day (June 13), the VIX spiked 23.14% despite another tame S&P loss of only 0.81%. As the updated chart shows, the ratio of 28.51 has become very unusual.

History suggests that the VIX is due for a mean reversion move (lower). XIV is usually a good vehicle for this mean reversion trade, but it is worth noting that contango tends to turn into backwardation when the VIX sustains trade above 20.

The Profit Radar Report kept it simple and recommended to short the S&P 500 at 2,110.

Continued S&P 500 and VIX analysis is available via the Profit Radar Report.

Simon Maierhofer is the founder of iSPYETF and the publisher of the Profit Radar Report. Barron’s rated iSPYETF as a “trader with a good track record” (click here for Barron’s profile of the Profit Radar Report). The Profit Radar Report presents complex market analysis (S&P 500, Dow Jones, gold, silver, euro and bonds) in an easy format. Technical analysis, sentiment indicators, seasonal patterns and common sense are all wrapped up into two or more easy-to-read weekly updates. All Profit Radar Report recommendations resulted in a 59.51% net gain in 2013, 17.59% in 2014, and 24.52% in 2015.

Follow Simon on Twitter @ iSPYETF or sign up for the FREE iSPYETF Newsletter to get actionable ETF trade ideas delivered for free.

S&P 500 Update

Last week’s update titled “Bears Get Another Shot at Taking Stocks Down” listed four reasons why bears get another shot and two reasons why stocks may continue higher.

This may sound like a contradiction, but it’s actually not. Basically we were looking for a good low-risk opportunity to go short. The higher stocks go, the better the opportunity (as long as you don’t short too early).

The June 1 Profit Radar Report observed some semi-bullish developments and stated that: “Surprises to the up side – to fool the crowded trade – are possible. The market may be tempted to flush out the ‘June pessimists’ first. That’s why we are very careful about initiating our short-trade.”

Barron’s rates the iSPYETF as a “trader with a good track record.” Click here for Barron’s assessment of the Profit Radar Report.

How exactly does being ‘careful about initiating our short-trade’ look like? We use support/resistance levels to our advantage.

The May 24 Profit Radar Report included the following recommendation:

We will go short if the S&P 500 moves above 2,090 (black trend channel) and subsequently drops below 2,084 (May 10 high). Waiting for a break of momentum (drop from 2,090 to 2,084) against resistance increases the odds of a winning trade. The approximate corresponding level for the ProShares S&P 500 Short ETF (SH) is: A drop below 20 followed by a rise above 20.06.”

The hourly chart below shows why 2,084 was important. A drop back below 2,084 would have triggered our sell, but as the green arrows indicate, the S&P 500 never drop that low. It touched the 2,088 – 2,085 zone four times, but bounced every time.

Anticipation of a potential ‘flush the bears spike’ combined with a carefully placed sell trigger kept us in the neutral zone instead of the losing side.

As the S&P 500 continued to rise, we elevated our sell trigger.

The S&P 500 shows a fairly drawn out bearish RSI divergence on the hourly chart, and – unlike the S&P 500 – the Dow Jones has not yet surpassed its April high.

This rally doesn’t have the typical ingredients for a sustained breakout.

Unfortunately there is no particular stopping point. The May 25 Profit Radar Report stated that: “A move to 2,011+/- or 2,034+/- is possible. Due to the market and Elliott Wave Structure at this time, there is no particular ‘make it or break it’ level.”

This trade is not one to be rushed, but unless breadth picks up, odds continue to favor a reversal lower in the not so distant future.

Continued S&P 500 analysis is available via the Profit Radar Report.

Simon Maierhofer is the founder of iSPYETF and the publisher of the Profit Radar Report. Barron’s rated iSPYETF as a “trader with a good track record” (click here for Barron’s profile of the Profit Radar Report). The Profit Radar Report presents complex market analysis (S&P 500, Dow Jones, gold, silver, euro and bonds) in an easy format. Technical analysis, sentiment indicators, seasonal patterns and common sense are all wrapped up into two or more easy-to-read weekly updates. All Profit Radar Report recommendations resulted in a 59.51% net gain in 2013, 17.59% in 2014, and 24.52% in 2015.

Follow Simon on Twitter @ iSPYETF or sign up for the FREE iSPYETF Newsletter to get actionable ETF trade ideas delivered for free.

How to Minimize the Risk Associated with Higher Returns

“What it means to be a successful investor in 2016 can be summed up in four words: bigger gambles, lower returns.” – Wall Street Journal

The Wall Street Journal just reported that investors need to pile on more risk just to get a reasonable return.

According to the WSJ and research by Callan Associates, in 1995, a portfolio of save bonds would return 7.5% with little risk and volatility.

Thanks to rock-bottom interest rates, and lackluster growth, investors are now forced to take on much more risk just to get close to a 7.5% return. How much more risk?

To eek out 7.5% in 2015, investors had to shrink their save bond position from 100% to just 12% and pump the remainder of their portfolio into much riskier assets.

The chart below illustrated the progression from high returns/low risk to high risk/low returns.

How to Reduce Risk

There are two approaches to reduce risk:

  1. Price: Only enter trades with a favorable risk/reward ratio
  2. Time: Not to be (fully) invested all the time

The Profit Radar Report utilizes both strategies to reduce risk.

Price

The Profit Radar Report recommends about 25 carefully selected trades per year. Trades that pass our intense qualifications are:

a) Low risk trades: Risk is reduced to a bare minimum or

b) High probability trades: The odds of being right are exceptionally high

This page explains our trade selection process.

The Profit Radar Report has outperformed the S&P 500 every year since inception. Performance details are available here.

Time

Because we only take the best trade setups, we are only invested a fraction of the year, and don’t have permanent default exposure to risk. For example, the Profit Radar Report did not have any equity exposure during the August 2015 and January 2016 mini-meltdowns.

If you are looking for a low-maintenance way to reduce risk and juice returns, the Profit Radar Report may be for you.

Simon Maierhofer is the founder of iSPYETF and the publisher of the Profit Radar Report. Barron’s rated iSPYETF as a “trader with a good track record” (click here for Barron’s profile of the Profit Radar Report). The Profit Radar Report presents complex market analysis (S&P 500, Dow Jones, gold, silver, euro and bonds) in an easy format. Technical analysis, sentiment indicators, seasonal patterns and common sense are all wrapped up into two or more easy-to-read weekly updates. All Profit Radar Report recommendations resulted in a 59.51% net gain in 2013, 17.59% in 2014, and 24.52% in 2015.

Follow Simon on Twitter @ iSPYETF or sign up for the FREE iSPYETF Newsletter to get actionable ETF trade ideas delivered for free.

Risk/Reward for Gold and Silver is Getting More Attractive, But …

On May 5, I received the following e-mail:

“Hi Simon, With all this volatility, why don’t you want to initiate any trades? For example a low risk trade as shorting XLU and QQQ? Gold, Silver, Platinum, Natural Gas, Oil look to me as a great long candidates. I don’t understand why you are staying on sidelines at the best time you can trade.”

Here is my reply:

“True, purely based on technicals, there are trades out there, but we lack confirmation of our other indicators to confirm such a trade. I have learned that no trade is better than a bad trade, and that a bad trade is more likely when data is conflicting. We didn’t short QQQ, because of the open chart gap. Feel free to go long gold or silver, and we’ll revisit how that trade is going in a few weeks (please see recent PRRs for more details on why we are not buying silver and gold at these prices). Seasonality for XLU is pretty strong the next several weeks, so shorting it is not ideal.

I’m itching to recommend a trade … once the risk profile improves. Hope this helps a bit. Best, Simon”

I haven’t yet sent an e-mail to revisit the gold and silver trade (I don’t like to rub things in, so I won’t), but lets take a moment to revisit gold and silver.

The April 20 Profit Radar Report looked at technicals, gold sentiment and gold seasonality and concluded the following:

Gold Update

Out of the three driving forces we monitor for gold (technicals, sentiment, seasonality), technicals look the most bullish. Sentiment says risk is elevated. Immediate up side potential is limited based on seasonality.

Important chart support is around 1,200 and 1,160 – 1,130. We are looking to buy gold at a price tag of 1,200 or below. We will reassess our buy limit once (and if) we get closer to 1,200.”

Barron’s rates the iSPYETF as a “trader with a good track record.” Click here for Barron’s assessment of the Profit Radar Report.

The same analysis along with long-term gold and silver charts and sentiment data were also published here on May 5: Gold and Silver Bulls Risk Painful Whipsaw

On Monday, gold fell as low as 1,202, which makes buying much more attractive than it was near 1,300. It now becomes an exercise of patience and fine-tuning to peg the right buy limit.

We may see another up/down sequence before a more ideal low (see chart for potential support levels). The biggest knock against buying right now remains gold sentiment.

Silver

The April 13 Profit Radar Report stated that: “A move above 16.40 could result in a move towards 17.8.”

Silver peaked at 18.075, and the April 24 Profit Radar Report warned that: “Seasonality and sentiment suggest danger ahead. We eventually would like to own silver, but the risk/reward ratio doesn’t become attractive until price drops towards 16 and below.”

Silver fell as low as 15.84 and retraced 50% of the prior gains. There are some oversold readings and silver may bounce, but more bullish sentiment will likely have to be worked off before a more lasting low is reached (see chart for potential support levels).

The corresponding ETF charts for gold and silver – SPDR Gold Shares (NYSEArca: GLD) and iShares Silver Trust (NYSEArca: SLV) – paint the same picture.

Continued gold and silver analysis is available via the Profit Radar Report.

Simon Maierhofer is the founder of iSPYETF and the publisher of the Profit Radar Report. Barron’s rated iSPYETF as a “trader with a good track record” (click here for Barron’s profile of the Profit Radar Report). The Profit Radar Report presents complex market analysis (S&P 500, Dow Jones, gold, silver, euro and bonds) in an easy format. Technical analysis, sentiment indicators, seasonal patterns and common sense are all wrapped up into two or more easy-to-read weekly updates. All Profit Radar Report recommendations resulted in a 59.51% net gain in 2013, 17.59% in 2014, and 24.52% in 2015.

Follow Simon on Twitter @ iSPYETF or sign up for the FREE iSPYETF Newsletter to get actionable ETF trade ideas delivered for free.


Bears Get Another Shot at Taking Stocks Down

The last S&P 500 updates highlighted support around 2,040 and why the S&P is likely to seesaw across this support to fool investors (S&P 500 Abuses Popular Pattern to Fool Investors).

Following the faux break below 2,040, the May 22 Profit Radar Report observed that: “Stocks delivered the fakeout move we anticipated. The recovery from Thursday’s low was strong enough to lead to further gains. A move beyond 2,066 could lead to 2,085+/-.”

Barron’s rates the iSPYETF as a “trader with a good track record.” Click here for Barron’s assessment of the Profit Radar Report.

The S&P obviously surpassed the initial up side target, and is now near the next resistance cluster, which gives the bears another shot at taking control.

The chart below shows a number of interesting developments:

  1. The S&P is following a pattern similar to May – July, and November – December, 2015 (blue boxes).
  2. The S&P reached the upper Bollinger Band for the first time since its April high.
  3. The S&P is overbought based on 2-day RSI (see vertical red lines).
  4. The CBOE Equity Put/Call Ratio dropped to 0.51, the lowest reading since July 30, 2015 (not shown).

None of the above patterns guarantee a break down, but they show that risk is rising. Rising risk translates into opportunity for bears.

Misconceptions

According to two CNBC headlines, June is a dangerous month for stocks:

  • May 31, 2016: “June is the worst month for markets” – CNBC
  • June 1, 2016: “This should have you worried about stocks in June” – CNBC

This is only half the truth however. June is also the S&P’s best month during election years.

The percentage of bullish investors polled by Investors Intelligence (II) jumped from 35.40% to 45.40%, one of the biggest one-week increases in 30 years.

At first glance, this appears to be bearish from a contrarian point of view, but history says it isn’t.

Similar optimism surges (as long as the percentage of bullish investors stayed below 50%) led to positive returns two months later 12 of 14 times (according to SentimenTrader).

Summary

Courtesy of the latest rally near overhead resistance, bears get another shot at taking control. In fact, there are two possible reversal zones.

Although odds favor (near-term) bearish bets, not all indicators point towards a deep correction. Therefore, precise trade execution and risk management are important to protect against a possible shakeout move.

Continued S&P 500 analysis is available via the Profit Radar Report.

Simon Maierhofer is the founder of iSPYETF and the publisher of the Profit Radar Report. Barron’s rated iSPYETF as a “trader with a good track record” (click here for Barron’s profile of the Profit Radar Report). The Profit Radar Report presents complex market analysis (S&P 500, Dow Jones, gold, silver, euro and bonds) in an easy format. Technical analysis, sentiment indicators, seasonal patterns and common sense are all wrapped up into two or more easy-to-read weekly updates. All Profit Radar Report recommendations resulted in a 59.51% net gain in 2013, 17.59% in 2014, and 24.52% in 2015.

Follow Simon on Twitter @ iSPYETF or sign up for the FREE iSPYETF Newsletter to get actionable ETF trade ideas delivered for free.