Is the Bull Market Over?

It’s time for an update on the most powerful stock market indicator in recent history – the major market top indicator.

This indicator (dubbed ‘secret sauce’) correctly foreshadowed the 1987, 2000 and 2007 market tops. The same indicator also ‘told us’ that the bull market will continue after the corrections of 2010, 2011, 2012 and thereafter.

A detailed explanation of this indicator (and why we call it ‘secret sauce’) is available for review here.

The October 8 column “The Missing Ingredient for A Major Market Top” mentioned a fledgling bearish non-confirmation (the first one since 2007).

Non-confirmations between the S&P 500 and ‘secret sauce’ are the first indication of a major market top. Here is how the October 5 Profit Radar Report assessed this fledgling divergence:

There is a small bearish divergence between the S&P 500 and the [indicator name replaced with ‘secret sauce’]. 
It is conceivable that this small divergence could mark a major top, but it is unlikely. Prior tops were preceded by multi-month divergences. Based on strong Q4/Q1 seasonality and the ‘need’ for a multi-month divergence, we expect new bull market highs later in 2014 or 2015.”

As proposed, strong seasonality and the ‘need for a multi-month divergence’ erased the fledgling divergence, and the S&P 500 moved to new all-time highs in 2015.

The May 17 Profit Radar Report noted a renewed bearish non-confirmation.

The May 31 Profit Radar Report observed the following:

At the latest all-time closing high for the S&P 500 (May 21), 27% of S&P 500 stocks traded within 2% of a 52-week high, while 13% of S&P 500 stocks already lost 20% or more since their latest high.
28% of S&P MidCap 400 stocks were within 2% of a 52-week high. 17% already lost more than 20%
16.8% of S&P SmallCap 600 stocks were within 2% of a 52-week high. 23% already lost 20% or more.
This internal deterioration and indication of buying selectivity is confirmed by [indicator name replaced with ‘secret sauce’] and the percentage of NYSE stocks above their 50-day SMA. 
Negative divergences like this tend to draw stocks lower. This doesn’t have to happen immediately, but this particular divergence has lasted longer than any other in the last years, and is likely to turn into a drag eventually.”

Eventually turned out to be August 19 – 24, when the S&P 500 lost 229 points in four days.

Is the Bull Market Over?

The updated chart below highlights the bearish non-confirmation noted in various Profit Radar Reports.

The 2015 divergence is more pronounced than the October 2014 divergence, but not as obvious as divergences seen prior to past major tops (4 – 24 months).

Based on the ‘secret sauce’ major market top indicator, the May 21 S&P 500 closing high could mark the last day of the post-2009 bull market. However, the bearish divergence is shorter than all recent historic precedents, so bulls and bears should be careful.

Old Bull or New Bear Market – It Doesn’t Matter (for now)

Just because the market hasn’t given a conclusive answer to the bull/bear market debate (yet) doesn’t mean we are in the dark.

Quite to the contrary, the S&P 500 has been following the path we identified months ago (we call it ‘our script’). What is ‘the script’?

The script is a comprehensive forecast (based on literally dozens of indicators and historical statistics) illustrated with one simple chart (read about it here and here).

The script pointed towards new lows (or at least a test of the August low at S&P 1,867). In fact, the September 20 Profit Radar report listed five reasons why stocks should head lower:

  • History: Panic declines, like in August, tend to be followed by a period of testing and another low, or at least a test of the low. Historical evidence: Since 1928, the S&P 500 dropped 10% or more from a 52-week high to a 3-month low, followed by a 3% bounce over 3 days (as was the case as of August 28) 21 times. 10 out of 21 times the S&P 500 tested or violated the low before going higher. 5 times the S&P staged a V-shaped recovery, and six times it eventually moved into a new bear market (3 of those 6 times the S&P rallied first before heading lower).
  • Seasonality: Late September/early October is one of the worst times for the S&P 500 in terms of seasonality (click here for S&P 500 seasonality chart).
  • The S&P 500 ended August with a loss of more than 5%. Since 1928, that’s happened 13 times (not including August 2015). The September after a 5% loss August was positive only 4 out of 13 times.
  • The 2011 script foretold a July/August sell off followed by weeks of sideways trading and another low.
  • Elliott Wave Theory combined with analysis of ‘rogue waves’.”

In short, our dashboard of indicators suggested that 2015 will follow the script of 2011.

A picture says more than a thousand words. For continued updates and out-of-the-box analysis, sign up for the Profit Radar Report.

Simon Maierhofer is the publisher of the Profit Radar Report. The Profit Radar Report presents complex market analysis (S&P 500, Dow Jones, gold, silver, euro and bonds) in an easy format. Technical analysis, sentiment indicators, seasonal patterns and common sense are all wrapped up into two or more easy-to-read weekly updates. All Profit Radar Report recommendations resulted in a 59.51% net gain in 2013 and 17.59% in 2014.

Follow Simon on Twitter @ iSPYETF or sign up for the FREE iSPYETF Newsletter to get actionable ETF trade ideas delivered for free.

If you enjoy quality, hand-crafted research, >> Sign up for the FREE iSPYETF Newsletter

Is the S&P 500 Forming a 2007-Like Top?

I got this e-mail from a loyal reader/subscriber the other day:

Hi Simon, I have been following your articles for a couple of years now. First of all, wanted to thank you for doing a great job. Most of the times, you are right on the spot. Since June or July of this year, you have been comparing the market’s behavior to the one of 2011’s. How about 2007? I see more parallels to 2007.”

That’s right. My favorite analogy has been 2011 (click here for more details).

Like 2011 (and 2015), 2007 is a pre-election year, and certainly worth a closer look.

The chart below compares the S&P 500 of 2007 with the year-to-date S&P.

One of the most obvious similarities between the S&P 500 of 2007 and 2015 is a nasty 10% summer ‘haircut.’

The key feature of the 2007 summer drop is that trade recovered thereafter, and didn’t drop below the 2007 panic low (red circle).

The equivalent 2015 panic low is 1,867 for the S&P. Will this level hold?

Sunday’s (September 20) Profit Radar Report listed four reasons why 1,867 is likely to be tested or broken:

  1. Seasonality. Bearish until mid-October
  2. History: When August ended with a 5% loss, the following September was positive only 4 out of 13 times.
  3. Triple Witching: Based on Friday’s Triple Witching loss, there was a 72.3% chance stocks will be down this week.
  4. 2011 template.

Unlike 2007, the S&P broke the sequence of higher lows (dashed green lines) this week.

This doesn’t mean that the S&P cannot soar to new all-time highs, like it did in 2007. I think Q4 stock performance will be more positive than Wall Street expects, but the odds favor a new low (or test of prior low) before a more sustainable rally.

There are a number of open chart gaps at higher levels (SPY 195.21 and 199.28) which may get filled, so even a trip to new lows is unlikely to be a direct route.

How can we tell if an ensuing rally (when it materializes) has what it takes to move to new all-time highs?

The September 20 Profit Radar Report looked at all the facts, including an updated look at the ‘Secret Sauce’ major market top indicator.

Simon Maierhofer is the publisher of the Profit Radar Report. The Profit Radar Report presents complex market analysis (S&P 500, Dow Jones, gold, silver, euro and bonds) in an easy format. Technical analysis, sentiment indicators, seasonal patterns and common sense are all wrapped up into two or more easy-to-read weekly updates. All Profit Radar Report recommendations resulted in a 59.51% net gain in 2013 and 17.59% in 2014.

Follow Simon on Twitter @ iSPYETF or sign up for the FREE iSPYETF Newsletter to get actionable ETF trade ideas delivered for free.

If you enjoy quality, hand-crafted research, >> Sign up for the FREE iSPYETF Newsletter

Will the S&P 500 Re-lapse or Re-cover?

There’s a time to speak and a time to be silent. You may have noticed that it’s been kind of ‘silent’ here at iSPYETF. Why?

There hasn’t been much new to report since we last looked at the S&P 500 on September 11.

The September 11 article “S&P 500 Analysis – The Next Turn” referred to the parallels between the S&P 500 of 2011 and S&P 500 of 2011.

Based on this analogy, we expected the S&P 500 to edge higher in a choppy fashion and eventually relapse to retest or break the initial August panic low at 1,867.

The article stated that: “There are a number of other possibilities, but at this point there is no reason to complicate matters. If the next moves don’t match our parameters (many of which were already shared with Profit Radar Report subscribers), we’ll adjust.”

It is rare for me to focus on just one outcome, but based on literally dozens of indicators and data points, the odds favored a path similar to what we saw in 2011 (updated chart below).

Thus far the S&P 500 has followed the outline almost perfectly, and there has been no reason to adjust.

While it looks like the S&P is now on its way to re-test or break 1,867, there is no time to gloat or rest either.

When things become too obvious, the market has a way of making things interesting and often delivers a curveball.

The market is always the final authority, but based on my indicators, we would be interested to buy new lows.

Target levels for a tradable price low and the scope of the next rally (bounce or new bull market highs) are available to Profit Radar Report subscribers.

Simon Maierhofer is the publisher of the Profit Radar ReportThe Profit Radar Report presents complex market analysis (S&P 500, Dow Jones, gold, silver, euro and bonds) in an easy format. Technical analysis, sentiment indicators, seasonal patterns and common sense are all wrapped up into two or more easy-to-read weekly updates. All Profit Radar Report recommendations resulted in a 59.51% net gain in 2013 and 17.59% in 2014.

Follow Simon on Twitter @ iSPYETF or sign up for the FREE iSPYETF Newsletter to get actionable ETF trade ideas delivered for free.
 

This VIX Trick is Stumbling Investors

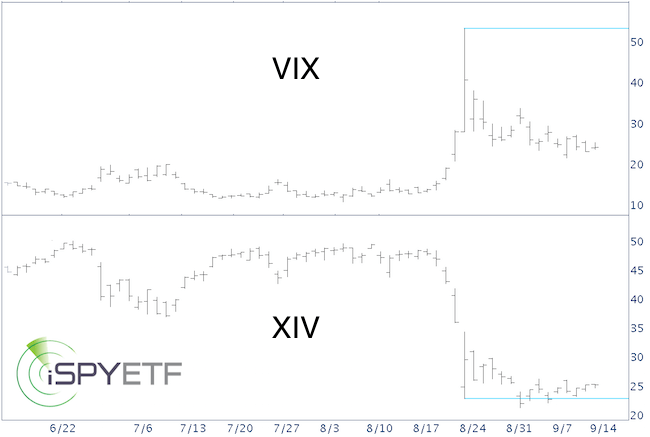
On August 24, the VIX briefly soared to 53.29, I was getting ready to leave for Europe that day, but saw the action on my phone and thought: “Boy, wish I had the time to figure out a good VIX short.”

I even wrote in the August 24 Profit Radar Report update that: “Today’s VIX high (53.29) will likely stand for a while. Buying XIV (inverse VIX ETN) is tempting, but the issue with XIV is that we may not have the benefit of contango right now, but the drag of backwardation.”

An explanation of contango and backwardation (along with the best seasonal VIX signal) is available here (last two paragraphs).

In short, backwardation is a condition that either increases XIV or SVXY losses or erodes XIV and SVXY gains while the VIX trades above 20 – 25.

The chart below plots the CBOE VIX against the VelocityShares Daily Inverse VIX ETN (NYSEArca: XIV). Another inverse VIX vehicle is the ProShares Short VIX ETF (NYSEArca: SVXY).

Although the VIX retreated more than 50% since August 24, XIV is up ‘only’ ~10% (SVXY is up ~8%).

Welcome to the power of backwardation.

Understanding contango and backwardation is vital for VIX investors.

Just as backwardation is hurting XIV and SVXY right now, contango will likely benefit them later on this year.

The VIX seasonality chart offers strong clues when the next good setup will be. This is the same VIX seasonality chart that triggered a buy signal in early July.

Simon Maierhofer is the publisher of the Profit Radar Report. The Profit Radar Report presents complex market analysis (S&P 500, Dow Jones, gold, silver, euro and bonds) in an easy format. Technical analysis, sentiment indicators, seasonal patterns and common sense are all wrapped up into two or more easy-to-read weekly updates. All Profit Radar Report recommendations resulted in a 59.51% net gain in 2013 and 17.59% in 2014.

Follow Simon on Twitter @ iSPYETF or sign up for the FREE iSPYETF Newsletter to get actionable ETF trade ideas delivered for free.

Investment ‘Pros’ are Bullishly Bearish

Investment advisors and newsletter-writing colleagues are as bearish right now as they were in March 2009, when the S&P briefly struck 666.

Yes, a quick 12% drop in 2015 caused the same fear as the biggest financial crisis since the Great Depression.

Ok, perhaps (even probably) that’s an exaggeration, but the investment pros (polled by Investors Intelligence) show the same fear now as they did at the end of the financial crisis. No matter how you slice it, that’s pretty remarkable.

The chart below, which plots the S&P 500 against the percentage of bullish investment advisors, offers a glimpse into advisors’ collective mind. 3 out of 4 advisors recommend staying away from stocks.

The dashed green lines mark similar investor sentiment extremes, which were not long-term bearish for stocks.

The only potential exception was a somewhat similar reading in July 2008 (dashed red line). But even this one sparked a notable rally before the bottom fell out.

Does this mean stocks can’t go any lower? By no means. But a drop below or test of the August 2015 panic lows may be a trap for bears.

That’s at least what this S&P 500 template (which also predicted the sharp August selloff) implies.

Simon Maierhofer is the publisher of the Profit Radar Report. The Profit Radar Report presents complex market analysis (S&P 500, Dow Jones, gold, silver, euro and bonds) in an easy format. Technical analysis, sentiment indicators, seasonal patterns and common sense are all wrapped up into two or more easy-to-read weekly updates. All Profit Radar Report recommendations resulted in a 59.51% net gain in 2013 and 17.59% in 2014.

Follow Simon on Twitter @ iSPYETF or sign up for the FREE iSPYETF Newsletter to get actionable ETF trade ideas delivered for free.

S&P 500 Analysis – The Next Turn

On June 15, I noticed (and wrote) that 2015 is Shaping up to Look a lot Like 2011.

In 2011, the S&P 500 fell 20% in July/August. 18% of that loss happened within a 3-week meltdown.

The rearview mirror shows a similar ‘crash’ in August 2015. Will the 2011/2015 analogy continue?

I suspect it will. Not tick for tick, nothing every does, but reasonably close.

The chart below plots the S&P 500 of 2011 (black line) against the S&P 500 of 2015 (blue line).

In 2011, the initial low (August 9 at 1,101.54) was followed by a multi-week consolidation and another new low (October 4 at 1,074.77).

According to Elliott Wave Theory (EWT), the 2011 decline followed a 5-wave format (see black numerical labels). Elliott Wave Theory is an exotic indicator, and should not be followed blindly, but there are times when EWT can be very helpful.

Now appears to be such a time.

A complete 5-wave decline, as happened in 2011, usually means two things:

  1. A bounce (or rally to new highs) is next
  2. A longer-term trend change may have occurred (this was not the case in 2011).

Regardless, a rally was to be expected after the initial (wave 3) low.

I noted via the August 24 Profit Radar Report that: “It looks like today’s low (1,867 for the S&P 500) marks the end of wave 3. Next should be a choppy and potentially violent wave 4 rebound.”

There are a number of other possibilities, but at this point there is no reason to complicate matters. If the next moves don’t match our parameters (many of which were already shared with Profit Radar Report subscribers), we’ll adjust.

For now, the likely path is the one outlined by the 2011 template: Perhaps more choppy sideways action, and a new low followed by a Q4 rally.

Simon Maierhofer is the publisher of the Profit Radar Report. The Profit Radar Report presents complex market analysis (S&P 500, Dow Jones, gold, silver, euro and bonds) in an easy format. Technical analysis, sentiment indicators, seasonal patterns and common sense are all wrapped up into two or more easy-to-read weekly updates. All Profit Radar Report recommendations resulted in a 59.51% net gain in 2013 and 17.59% in 2014.

Follow Simon on Twitter @ iSPYETF or sign up for the FREE iSPYETF Newsletter to get actionable ETF trade ideas delivered for free.