Relentless is one way to describe the stock market rally from the March low. Unusual is another, and recently it’s gotten plain odd.
Relentless & Unusual
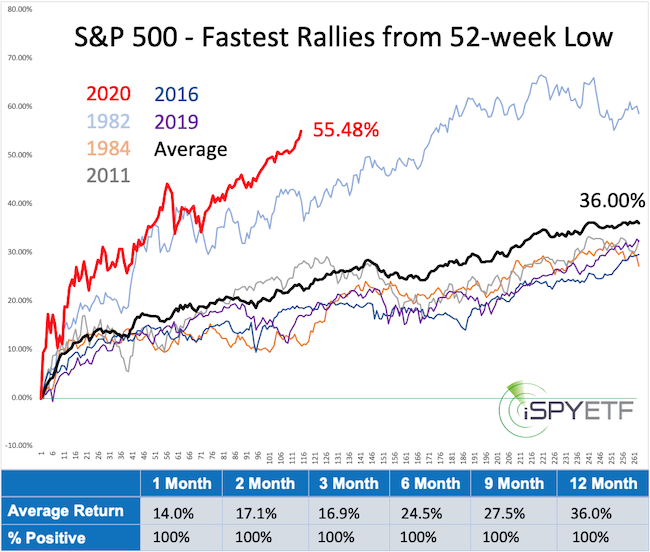
The chart below shows the relentless and unusual nature. I first published the chart on April 7, when it became clear that this rally was going to be strong. The various graphs below show the trajectory of the fastest rallies from a 52-week low.
As the performance tracker shows (based on forward performance as of April 7), initial strength always continued, but this rally has broken all record.
Odd – Exhibit #1
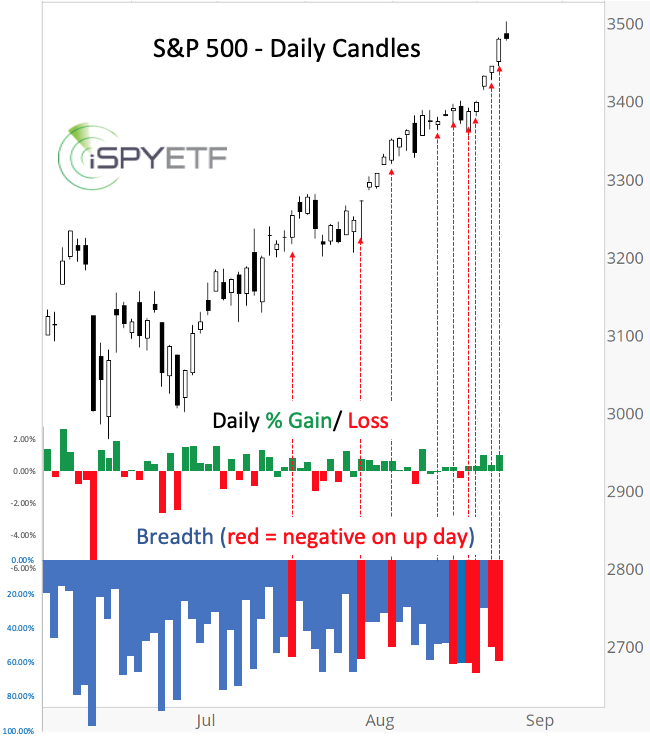
Here is where things get odd. On July 20, the S&P 500 closed 0.84% higher, but 57% of all NYSE-traded stocks ended lower. This anomaly occurred 7 more times since.
The chart below plots the S&P 500 against the daily percentage change and percentage of declining stocks. The red arrows highlight days when the S&P closed higher despite a majority of stocks closing lower.
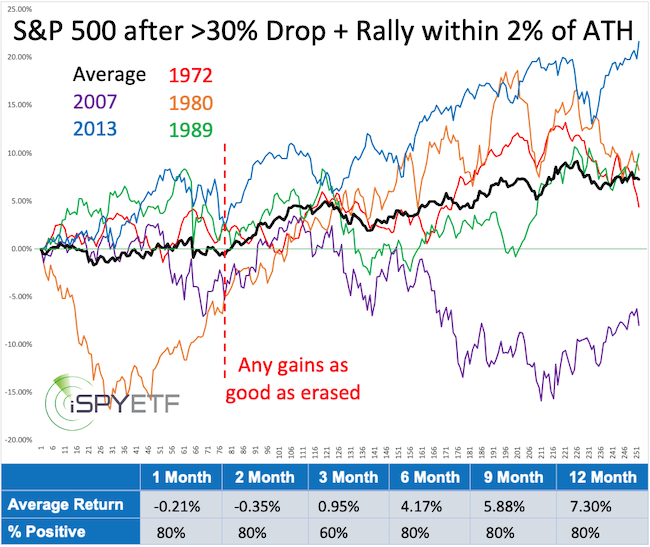
S&P 500 rallies despite more declining than advancing stocks have only occurred in two other distinct periods over the past 50 years.
Odd – Exhibit #2
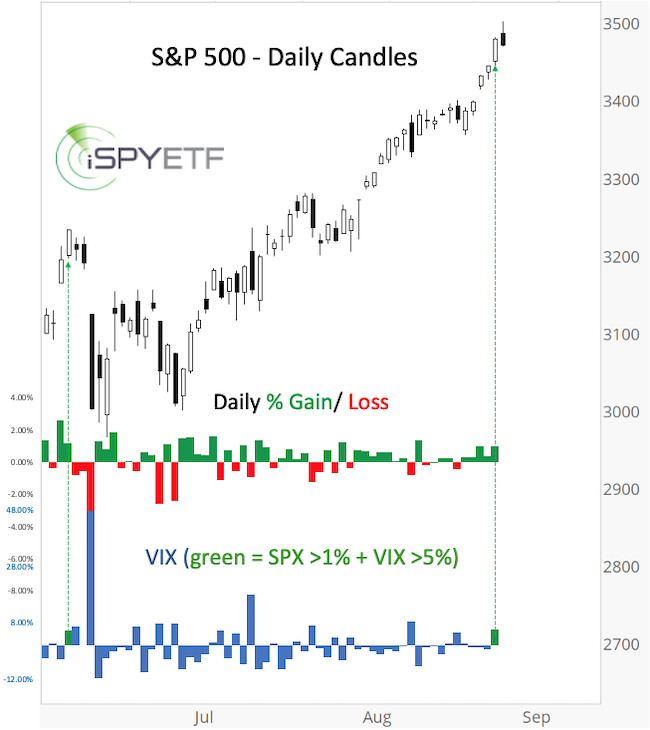
Yesterday (August 26), the S&P 500 ended the day with a 1.02% gain, but the VIX rose 5.63%. Since there is an inverse relationship between the S&P 500 and the VIX, this is a very unusual reading.
In fact, since 1997, there’s been only one other time when the S&P 500 gained more than 1% and the VIX gained more than 5%. It was on June 8, 2020 (see chart below).
If we relax the parameters to include every instance where the S&P gained more than 1% and the VIX more than 3%, we get 10 other instances over the past 20 years.
Do Oddities Matter
The March 26 Profit Radar Report looked at a number of indicators (including liquidity) and concluded that: “We anticipate a recovery towards 3,000 (for the S&P 500) over the next couple months and quite possibly new all-time highs in 2020.”
Barron’s rates iSPYETF as “trader with a good track record” and Investor’s Business Daily says: “When Simon says, the market listens.” Find out why Barron’s and IBD endorse Simon Maierhofer’s Profit Radar Report
New all-time highs are no surprise to subscribers of the Profit Radar Report, but that stocks got there without any significant pullback is unusual, even unprecedented.
But we are here now, and I’ve found that most investors approach the market in one of three ways:
- Get out of the market because it doesn’t make sense anymore
- Buy because the Federal Reserve will keep stocks afloat
- Stay informed and look at indicators that work most of the time (the kind of indicators that sniffed out the March low and projected a powerful rally) and put the odds in your favor.
If option #3 sounds most appealing to you, and if you would like to find out the other rare and unique times in history when 1) S&P 500 and VIX went up at the same time and 2) S&P 500 rallied with more declining than advancing stocks, you will find the Profit Radar Report of interest.
Simon Maierhofer is the founder of iSPYETF and the publisher of the Profit Radar Report. Barron’s rated iSPYETF as a “trader with a good track record” (click here for Barron’s evaluation of the Profit Radar Report). The Profit Radar Report presents complex market analysis (S&P 500, Dow Jones, gold, silver, euro and bonds) in an easy format. Technical analysis, sentiment indicators, seasonal patterns and common sense are all wrapped up into two or more easy-to-read weekly updates. All Profit Radar Report recommendations resulted in a 59.51% net gain in 2013, 17.59% in 2014, 24.52% in 2015, 52.26% in 2016, and 23.39% in 2017.
Follow Simon on Twitter @ iSPYETF or sign up for the FREE iSPYETF e-Newsletter to get actionable ETF trade ideas delivered for free.