S&P 500 Update

Summer was great … as long as you didn’t spend your days staring at charts, because nothing happened there.

From July 11 – September 8, stocks didn’t go anywhere. We didn’t even bother trading stocks.

But all boring periods must come to an end. The August 28 Profit Radar Report stated that:

What we are focused on for now is the most likely scope of any pullback. We prefer to see lower prices (the lower the better) and will start to leg into long positions at different levels.”

Barron’s rates iSPYETF as “trader with a good track record” and Investor’s Bussines Daily says “When Simon says, the market listens.” Find out why Barron’s and IBD endorse Simon Maierhofer’s Profit Radar Report.

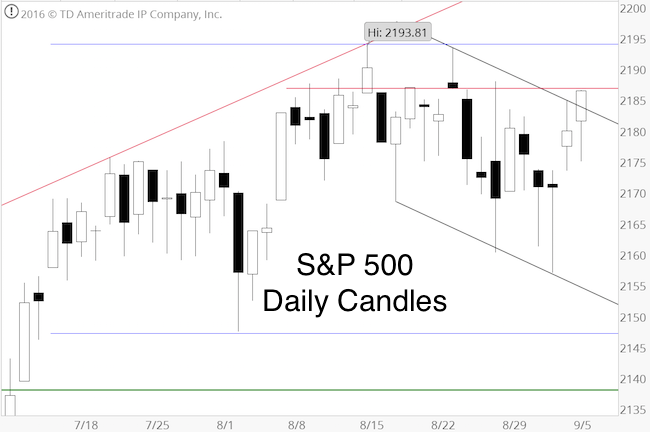
Since late July, our first buy trigger has been waiting at S&P 2,140 (=SPY 214.20). Months of patience (and not chasing the up side) paid off on September 9 when the S&P 500 dropped below 2,140.

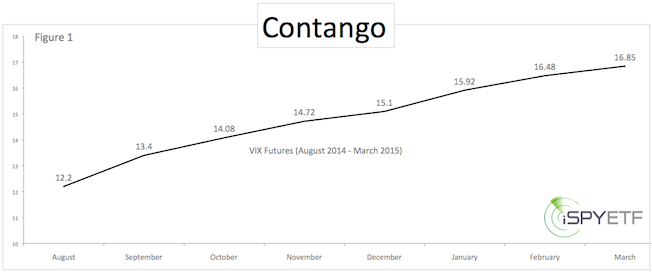
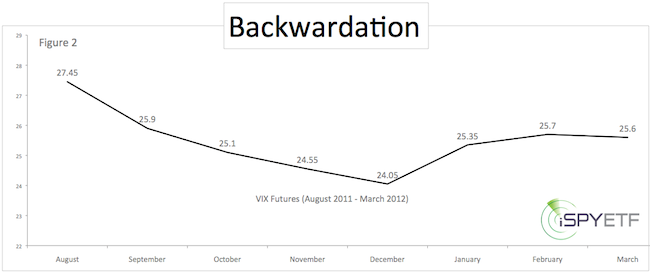
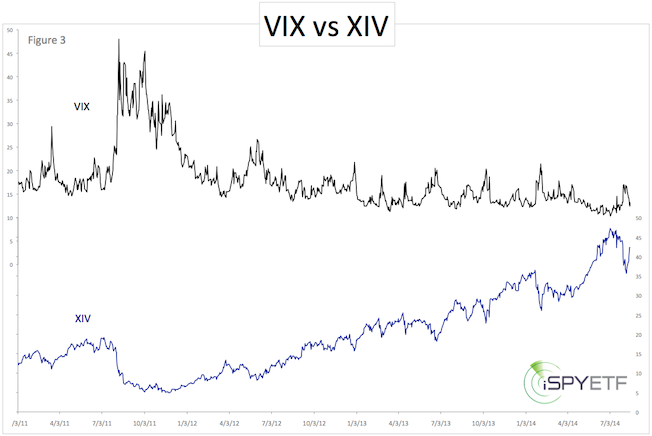
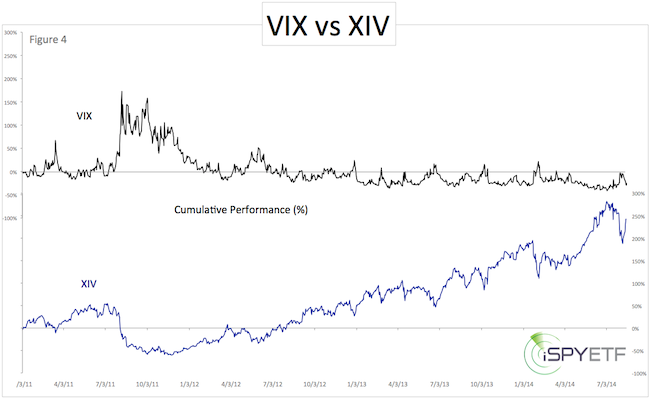
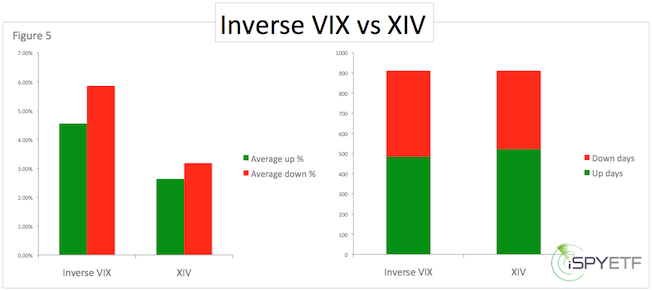
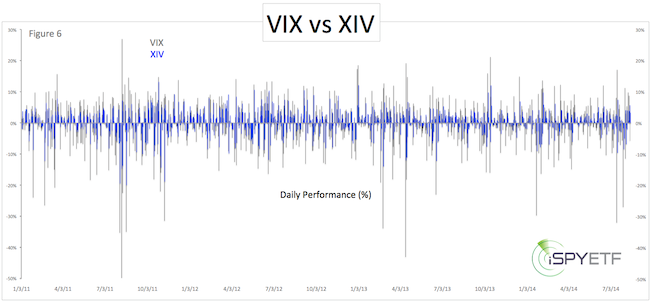
Since buying SPY on September 9, we also bought the iShares Russell 2000 ETF (IWM) and the VelocityShares Daily Inverse VIX ETN (XIV). This article explains why shorting the VIX via XIV is such an attractive trade: The Spectacular VIX Tailwind Trade

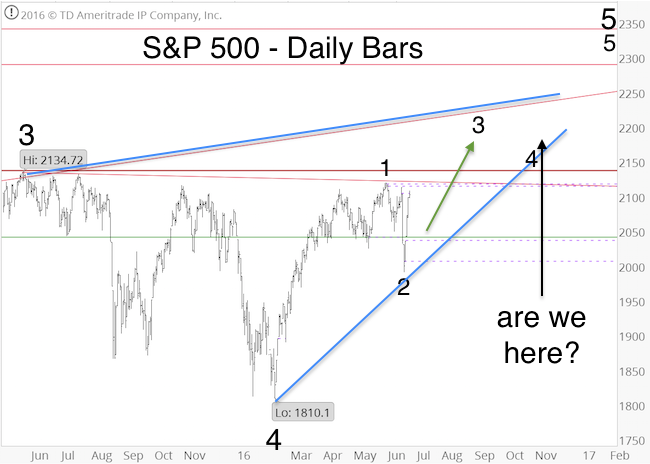
We started to leg into various long positions because the weight of evidences suggests higher prices for the remainder of 2016.

However, although the S&P (and Russell 2000) reached our first down side target, the performance since hasn’t been too confidence inspiring. It is missing the escape velocity we saw in February and June.

In February, the S&P bottomed near 1,800 and experienced a breadth thrust (we discussed this here: 2016 Bear Market Risk is Zero Based on this Rare but Consistent Pattern).

There was also a breadth thrust right after the Brexit low in June. This kickoff rally along with two longer-term projections was detailed here: Stock Market Melt-Up Alert?

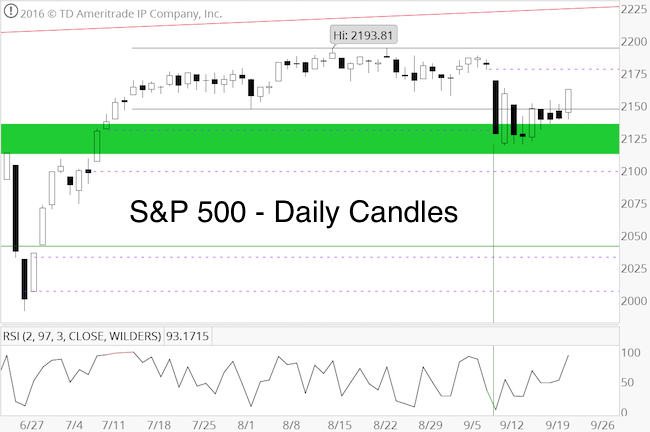
In the spirit of risk management (a bird in the hand is better than two in the bush), we trimmed our positions in XIV and IWM and cashed in some profits. Although today’s spike looks good, 2-day RSI is reaching overbought, and seasonality tends to be weak this time of year.

For now, we are happy to have bought SPY, IWM and XIV near the September lows. When stocks are up, it’s better to be long and worry about a possible relapse than being in cash (or worse short) and worry about having missed the bottom. We can now play with ‘house money.’

Continued S&P 500 updates are available via the Profit Radar Report.

Simon Maierhofer is the founder of iSPYETF and the publisher of the Profit Radar Report. Barron’s rated iSPYETF as a “trader with a good track record” (click here for Barron’s profile of the Profit Radar Report). The Profit Radar Report presents complex market analysis (S&P 500, Dow Jones, gold, silver, euro and bonds) in an easy format. Technical analysis, sentiment indicators, seasonal patterns and common sense are all wrapped up into two or more easy-to-read weekly updates. All Profit Radar Report recommendations resulted in a 59.51% net gain in 2013, 17.59% in 2014, and 24.52% in 2015.

Follow Simon on Twitter @ iSPYETF or sign up for the FREE iSPYETF Newsletter to get actionable ETF trade ideas delivered for free.


Are Gold and Silver Setting up for a Slingshot Move?

Gold and silver have been stuck in their respective trading range for three months.

How long the yawning continues remains to be seen, but a slingshot move would be a welcome change of pace. What is a slingshot move? It’s a powerful directional move preceded by a fakeout step.

The review below explains the potential slingshot setup:

The July 4 and July 7 Profit Radar Reports highlighted various conflicting indicators and decided that: “With both metals approaching our up side targets, we don’t want to chase trade.”

The chart below, published via the July 7 Profit Radar Report, shows two of the conflicting indicators for gold:

  • Investor Sentiment (commercial hedgers’ exposure – light blue graph): Bearish for gold
  • Seasonality (dark blue graph): Bullish for gold

Silver essentially suffered the same conflict and was nearing a resistance clusters.

The July 4 Profit Radar Report showed the chart below along with the following commentary:

Silver is overbought. In general, large spikes are followed by sideways trading or sizeable drops. Aggressive traders may find success shorting silver (corresponding ETF: ZSL).”

In hindsight it becomes obvious that bullish seasonality and bearish sentiment cancelled each other out, resulting in the three-month stalemate.

Some sort of a trading range is usually the result when our indicators are in conflict, that’s why we generally don’t trade during such periods (the Profit Radar Report’s last precious metals recommendation was to buy gold at 1,088 in November 2015).

The Slingshot Move

As the above charts show, gold and silver reached the low end of our up side targets. Gold and silver have been stair-stepping lower ever since (see updated charts below).

Our intention was to short gold and silver in their respective resistance areas. Unfortunately they never fully got there.

New Bear Market Lows?

The question now is whether the top is in or not?

The best-case scenario would be a swift rally into the red resistance zone (above 1,380 for gold, above 21.2 for silver). We’d consider this rally the slingshot move (fakeout rally before sizeable decline).

The rally to new recovery highs would get bulls excited just before a considerable down side reversal (and quite possibly a drop below $1,000/oz for gold).

However, the best-case scenario may not happen. Gold and silver as good as touched the bottom of our up side targets, which may be enough. A sizeable top may already be in place (watch green support areas).

The strategy for precious metals is to sell the bounces. Now we just need to figure out how big the bounces will be.

Continuous updates for gold and silver are available via the Profit Radar Report.

Simon Maierhofer is the founder of iSPYETF and the publisher of the Profit Radar Report. Barron’s rated iSPYETF as a “trader with a good track record” (click here for Barron’s profile of the Profit Radar Report). The Profit Radar Report presents complex market analysis (S&P 500, Dow Jones, gold, silver, euro and bonds) in an easy format. Technical analysis, sentiment indicators, seasonal patterns and common sense are all wrapped up into two or more easy-to-read weekly updates. All Profit Radar Report recommendations resulted in a 59.51% net gain in 2013, 17.59% in 2014, and 24.52% in 2015.

Follow Simon on Twitter @ iSPYETF or sign up for the FREE iSPYETF Newsletter to get actionable ETF trade ideas delivered for free.


The Spectacular VIX Tailwind Trade

This is a reprint of the August 24 Special Profit Radar Report:

The CBOE Volatility Index (VIX) is a popular index, but in itself is not investable. You can’t just go out and buy the VIX. The same is true for the S&P 500 or any other index.

But investment vehicles like the SPDR S&P 500 ETF, which aims to replicate the performance of the S&P 500 index, make it possible to invest in indexes.

Duplicating the performance of the S&P 500, however, is much easier than creating a vehicle that mimics the VIX. Fund managers simply purchase the stocks that make up the S&P 500 to create an S&P 500-like product.

It doesn’t work like this for the VIX. Here’s why:

There is no ‘VIX stock.’ The only way to invest in the VIX is via futures or options, which are complex financial instruments. ETFs, ETNs or other ETP’s use futures or options to attain ‘VIX-like’ performance. VIX futures and options generally suffer from some sort of time decay.

Explained: Contango

The VIX quoted in-day-to-day life is the CBOE Volatility Index (VIX) spot price (today’s VIX price). However, the futures used to create ETPs like the iPath S&P 500 VIX Short-Term Futures ETN (VXX) are based on the future VIX price, which is almost always more expensive than the spot price. Over time the more expensive VIX futures decline in value, eventually converging with the spot price at expiration.

Figure 1 compares the current spot price with various futures prices. The difference between the spot price (12.20) and the September futures (13.45) is 9.84%. In other words, it will take a 9.84% move in the VIX to neutralize the time decay between the spot and September futures price.

As time goes by, ETF providers are forced to continuously replace expiring futures with new (more expensive) futures (this process is called ‘rolling over’). The further away the futures expiration date, the bigger the time premium. This time premium and resulting value decay is called contango.

Contango generally exists when the VIX is flat or trending lower. Even gradual increases when the VIX is below 20 tend to occur in an environment of contango.

Backwardation (figure 2) is the opposite of contango. Backwardation generally appears only during times of panic and significant VIX spikes above 20.

To sum up, contango erodes investors’ returns during periods of a flat or falling VIX.

How to Profit from Contango

We don’t expect a major stock market top yet, therefore the period of low volatility is likely to continue (or resume after the seasonal October VIX high).

Is it possible to use contango in our favor?

Figure 3 plots the VIX against the VelocityShares Daily Inverse VIX Short-Term ETN (XIV), and reveals a very simple truth: XIV has risen much more than the VIX has fallen.

Figure 4 shows the cumulative gain/loss from January 3, 2011 to August 15, 2014. The VIX lost 25%. XIV gained 242%. XIV returned 217% more than the inverse VIX.

XIV’s objective (and the objective of every other inverse or leveraged ETP) is to replicate the daily (not long-term) inverse performance of the VIX, but regardless, this kind of excess return is worth exploring.

Here is a more detailed breakdown of XIV’s excess return.

XIV is an inverse VIX ETN. For an apples to apples comparison, we are comparing XIV with a simple inverse VIX.

Of the 911 trading days from January 3, 2011 to August 15, 2014, the inverse VIX had 484 up days and 427 down days. The inverse VIX had 1.13x more up than down days.

The average gain of 484 up days was 4.55%. The average loss of 427 down days was 5.85%. The average loss was 1.28x greater than the average gain.

Of the 911 trading days from January 3, 2011 to August 15, 2014, XIV had 522 up days and 389 down days. XIV had 1.34x more up than down days.

The average gain of 522 up days was 2.63%. The average loss of 389 down days was 3.18%. The average loss was 1.21x greater than the average gain (see figures 5 and 6).

Summary

Since 2011, XIV outperformed the inverse VIX by 217% (0.24% per day). Although there are other factors at work, the excess return of 0.24% per day is largely attributed to the effect of contango.

Contango does not guarantee a profitable trade or protect against losses. From July 7 – November 21, 2011 XIV lost 75%. There are also times where the VIX moves lower and XIV loses value (i.e. August 18 – 21, 2014).

Over time however, contango significantly enhances the odds of a successful XIV trade, especially when XIV is purchased during times of VIX spikes.

A list of VIX Exchange Traded Products that benefit from contango, a updated VIX seasonality chart, and actual buy/sell signals are available via the Profit Radar Report.

Simon Maierhofer is the founder of iSPYETF and the publisher of the Profit Radar Report. Barron’s rated iSPYETF as a “trader with a good track record” (click here for Barron’s profile of the Profit Radar Report). The Profit Radar Report presents complex market analysis (S&P 500, Dow Jones, gold, silver, euro and bonds) in an easy format. Technical analysis, sentiment indicators, seasonal patterns and common sense are all wrapped up into two or more easy-to-read weekly updates. All Profit Radar Report recommendations resulted in a 59.51% net gain in 2013, 17.59% in 2014, and 24.52% in 2015.

Follow Simon on Twitter @ iSPYETF or sign up for the FREE iSPYETF Newsletter to get actionable ETF trade ideas delivered for free.

September is Here, Could it Make Sense to Buy Stocks in Worst Month of Year?

The July 4, 2016 Profit Radar Report featured the following S&P 500 projection.

Based on this projection, the S&P was to rally to about 2,195 followed by a pullback to about 2,155.

Barron’s rates iSPYETF as a “trader with a good track record.” Click here for Barron’s assessment of the Profit Radar Report.

Despite a prolonged trading range, the S&P followed this projection very closely. It rallied as high as 2,193.81 and subsequently slid as low as 2,157.09 (see ‘are we here’ arrow).

Does that mean that the next leg higher us about to launch?

The Big Question

It could be. The question is whether stocks will correct further before the next rally or not.

Under normal condition, stocks should pull back further. However, we’ve seen one of the longest and tightest trading ranges in history (July 14 until today).

This trading range was enough to digest over bought readings caused by the post-Brexit spike. We may have just seen a correction in time rather than price.

However, in terms of seasonality, September is the worst month of the year. Buying in September is less than ideal.

October, on the other hand, has often served as launching pad, most recently in 2014 and 2015.

Best Setup

Further weakness with targets around 2,150 – 2,130 and 2,130 – 2,070 reached later in September or in October would certainly set up a much better buying opportunity than chasing price around 2,200 in September.

We consider any pullback into the above ranges a gift. Life is always more pleasant if you receive a present. If we’ll get it, we’ll certainly accept it (buy stocks), but we can’t bank on it.

If the market moves higher soon without noteworthy pullback, we’ll have to deal with it, and determine whether it’s a temporary or a sustainable move higher.

Short-term, the S&P has broken outside of the descending black trend channel and butting against minor resistance (see chart above). Based on the put/call ratio and short-term RSI, the S&P is nearing overbought, but as long as trade remains above the black trend channel, the S&P may venture higher.

Continued updates are available via the Profit Radar Report.

Simon Maierhofer is the founder of iSPYETF and the publisher of the Profit Radar Report. Barron’s rated iSPYETF as a “trader with a good track record” (click here for Barron’s profile of the Profit Radar Report). The Profit Radar Report presents complex market analysis (S&P 500, Dow Jones, gold, silver, euro and bonds) in an easy format. Technical analysis, sentiment indicators, seasonal patterns and common sense are all wrapped up into two or more easy-to-read weekly updates. All Profit Radar Report recommendations resulted in a 59.51% net gain in 2013, 17.59% in 2014, and 24.52% in 2015.

Follow Simon on Twitter @ iSPYETF or sign up for the FREE iSPYETF Newsletter to get actionable ETF trade ideas delivered for free.