The Biggest VIX Anomaly of the Year is Here

Since 1970, the S&P 500 has seen a ‘Santa Claus Rally’ (SCR) 73.9% of the time (SCR equals last five days of old year and first 2 days of new year).

Purely based on seasonality, there’s a good chance the S&P 500 will move higher in the coming days.

Due to the fairly predictable inverse correlation between the S&P 500 and the VIX, one would expect the VIX to move lower during the SCR period of the year.

However, that’s not the case. In fact, this is the biggest VIX anomaly of the year and is relected in VIX seasonality.

The December 27, 2015 Profit Radar Report observed this anomaly and stated:

On Thursday the VIX painted a potential reversal candle, which – combined with seasonality – will probably make it harder for the VIX to move much lower. Usually the mix moves in the opposite direction of stocks, however this inverse relationship tends to take a break from Christmas to New Years.”

During the 2015/16 SCR period, the VIX lost 24.21%.

We love shorting the VIX via the VelocityShares Inverse VIX ETN (XIV – here is why: The Spectacular VIX Tailwind Trade), that’s why this anomaly is so interesting.

In 2016, the Profit Radar Report recommended shorting the VIX (= buying XIV) twice for gains of 14.46% and 13.33%.

Various indicators go into a XIV buy signal, seasonality is one of them. Right now, seasonality is not in favor of buying XIV (even if the S&P 500 moves higher).

Continuous S&P 500/VIX updates with actual buy/sell recommendation are available via the Profit Radar Report.

Simon Maierhofer is the founder of iSPYETF and the publisher of the Profit Radar Report. Barron’s rated iSPYETF as a “trader with a good track record” (click here for Barron’s profile of the Profit Radar Report). The Profit Radar Report presents complex market analysis (S&P 500, Dow Jones, gold, silver, euro and bonds) in an easy format. Technical analysis, sentiment indicators, seasonal patterns and common sense are all wrapped up into two or more easy-to-read weekly updates. All Profit Radar Report recommendations resulted in a 59.51% net gain in 2013, 17.59% in 2014, and 24.52% in 2015.

Follow Simon on Twitter @ iSPYETF or sign up for the FREE iSPYETF Newsletter to get actionable ETF trade ideas delivered for free.


Comprehensive S&P 500 Analysis Reveals Longevity of this Rally

The S&P 500 has soared almost 10% since Election Day. This move has been dubbed the Trump rally or Trump bump.

The media is quick to slap a label on an event (especially after the fact), but lest we forget that the media, analysts and pundits a) did not see a DJ Trump win and b) expected a market crash in the unlikely event of a DJ Trump win.

Key stock market indicators strongly suggested prior to the election that stocks would rally regardless of the election outcome (the four most powerful stock market indicators are discussed in detail here).

Here is what indicators said before the election, and what they are still telling us today:

Money Flow

The stock market is a supply and demand-based market place, that’s why money flow is one of the most important indicators. Falling demand will eventually be followed by falling prices and vice versa.

The September 25 Profit Radar Report published the chart below. The dark and light blue graphs make up our favorite money flow indicator (two versions of the same indicator). This indicator has correctly foreshadowed the 1987, 2000 and 2007 bear markets and projected higher prices since 2009 (except for a brief ‘caution’ signal in 2015). The indicator and its track record is discussed in detail here.

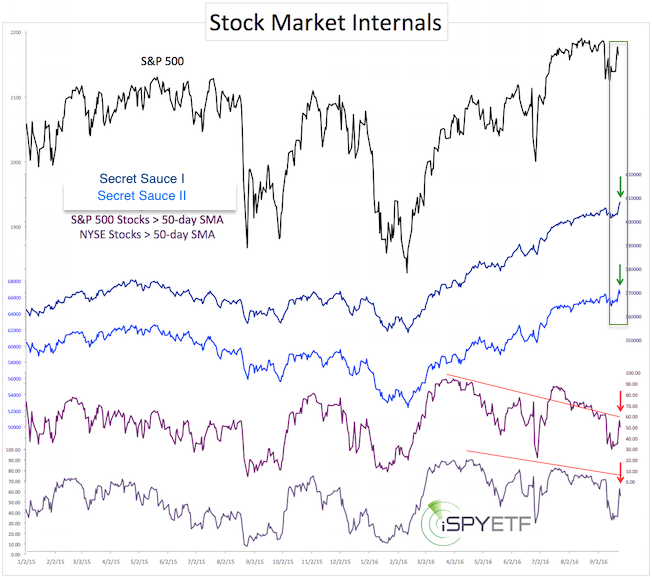
Out of respect for paying subscribers (who know the indicator’s real name), we will call this indicator ‘secret sauce.’

On September 22, the ‘secret sauce’ money flow indicator (blue graphs) rallied to new all-time highs even though the S&P 500 did not. This was to be longer-term bullish, because rising demand was to be followed by rising prices.

The percentage of stocks above their 50-day SMA (purple graphs) did not confirm the new ‘secret sauce’ highs. This suggested short-term weakness.

The September 25 Profit Radar Report concluded the following: “Longer-term: We are still looking for the S&P 500 to reach our long-standing up side target around 2,300. Short-term: We are waiting whether the S&P will break below 2,119 prior to moving higher.”
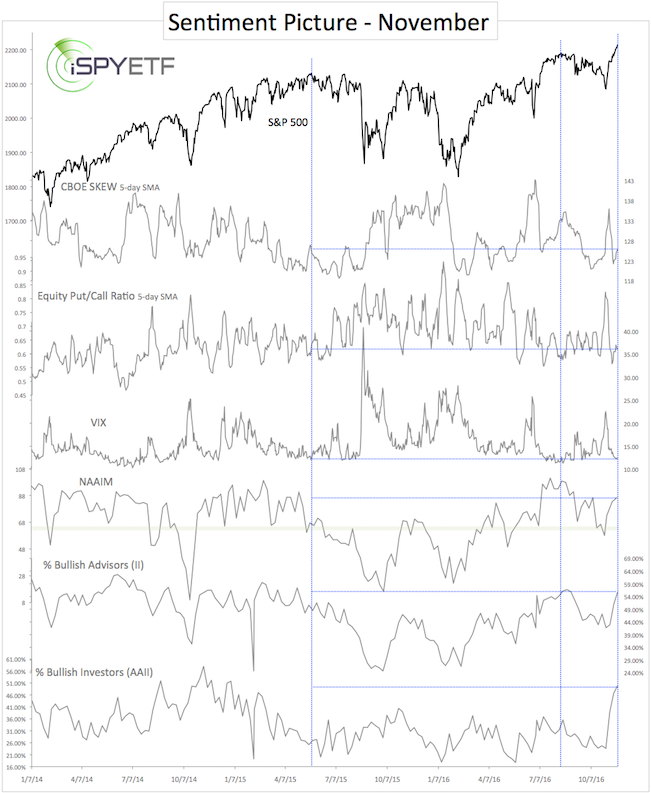
Investor Sentiment

Investors have been predominantly bearish throughout this bull market. Based on bearish investor sentiment (bullish for stocks), we never wavered from our position that a major market top is not visible.

For example, the Profit Radar Report’s 2016 S&P 500 Forecast stated back in January that: “Investor sentiment near the May 2015 all-time highs was not as euphoric as at prior tops and not bullish enough for a major market top.”

The January 29 Profit Radar Report, however, pointed out bearish sentiment extremes (bullish for stocks) and noted that: “The pessimistic extremes were relieved enough to allow for another drop lower in the coming days. A drop lower is not required, but would be a good buying opportunity if it happens.”

The buying opportunity appeared in February, when the S&P 500 dropped into the low 1,800s.

The most recent comprehensive sentiment update (November 27 Profit Radar Report) compared current sentiment with the 2015 S&P 500 highs (see chart below).

The conclusion: “On average, investors today are still not as bullish as one would expect at a major market top. This allows for, and suggests, further gains in the months to come.”

Technical Analysis

The August 28 Profit Radar Report showed three uber-bullish forward projections (shown here) and stated that: “At this point we don’t know the scope of any pullback, but EWT and the June breadth thrust suggest that any weakness will be bought (perhaps even furiously). We consider the longer-term up side potential to be significantly larger than the down side risk.”

The June breadth thrust is discussed in detail here: 2016 Bear Market Risk is Zero Based on this Rare but Consistent Pattern

A detailed technical analysis and Elliott Wave Theory-based outlook is available here: S&P 500 Update – Expect the Abnormal (the ‘abnormal’ refers to continuous gains despite overbought conditions).
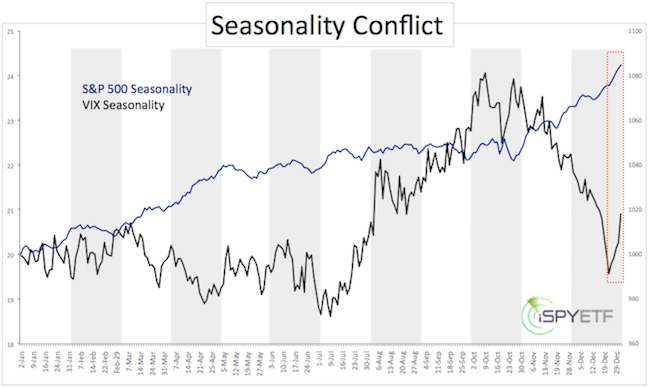
Seasonality

S&P 500 seasonality is bullish for the entire fourth quarter into the New Year.

Conclusion

All important indicators pointed higher before the election. The question was only how much of a pullback and how deep of a shakeout move we’ll get prior to the melt up. “The question therefore is not if stocks will rally, but when they will rally” was the conclusion shared in this MarketWatch article.

An indicator-based investment approach is superior to a news-based approach.

Using multiple credible and time-tested indicators further enhances results, especially when all indicators point in the same direction (such as before the election).

The image below illustrates how the odds of a winning trade are improved by a multi-indicator approach.

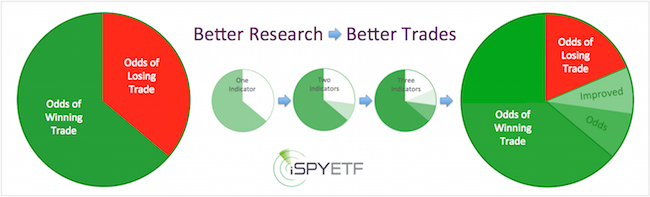
This doesn’t guarantee a profitable trade, but Profit Radar Report subscribers rarely ever find themselves on the wrong side of the trade.

Short-term, the market is overbought and over-loved and may pull back, but the bullish longer-term factors present months ago (aside from sentiment) remain valid.

Continuous updates with actual buy/sell recommendation are available via the Profit Radar Report.

Simon Maierhofer is the founder of iSPYETF and the publisher of the Profit Radar Report. Barron’s rated iSPYETF as a “trader with a good track record” (click here for Barron’s profile of the Profit Radar Report). The Profit Radar Report presents complex market analysis (S&P 500, Dow Jones, gold, silver, euro and bonds) in an easy format. Technical analysis, sentiment indicators, seasonal patterns and common sense are all wrapped up into two or more easy-to-read weekly updates. All Profit Radar Report recommendations resulted in a 59.51% net gain in 2013, 17.59% in 2014, and 24.52% in 2015.

Follow Simon on Twitter @ iSPYETF or sign up for the FREE iSPYETF Newsletter to get actionable ETF trade ideas delivered for free.


Top Shelf Traders Features iSPYETF’s Profit Radar Report

Top Shelf Traders, a monthly eMagazine for active investors and traders, just featured iSPYETF’s Profit Radar Report.

Every month, Top Shelf Trader introduces unique approaches to trading stocks, options, futures, and Forex.

The Profit Radar Report is featured in the “Stock” section.

A complimentary look at Top Shelf Trader is available here.

Simon Maierhofer is the founder of iSPYETF and the publisher of the Profit Radar Report. Barron’s rated iSPYETF as a “trader with a good track record” (click here for Barron’s profile of the Profit Radar Report). The Profit Radar Report presents complex market analysis (S&P 500, Dow Jones, gold, silver, euro and bonds) in an easy format. Technical analysis, sentiment indicators, seasonal patterns and common sense are all wrapped up into two or more easy-to-read weekly updates. All Profit Radar Report recommendations resulted in a 59.51% net gain in 2013, 17.59% in 2014, and 24.52% in 2015.

Follow Simon on Twitter @ iSPYETF or sign up for the FREE iSPYETF Newsletter to get actionable ETF trade ideas delivered for free.

If you enjoy quality, hand-crafted research, >> Sign up for the FREE iSPYETF Newsletter

Russell 2000 Delivers New All-time High with Bearish Divergence

The Russell 2000 has been on a tear. On November 28, the R2K ended a 15-day winning streak when it touched red trend line resistance at 1,349 mentioned by the Profit Radar Report.

This pullback was to be temporary. The November 30 Profit Radar Report stated that: “The R2k is nearing an oversold condition and strong support at 1,309 – 1,296,” and recommended to buy R2k at 1,305. The corresponding level for the iShares Russell 2000 ETF (IWM) was 129.90.

Now the R2K is back at trend line resistance, but this time it carved out a bearish RSI divergence. There was no such divergence on November 25, which strongly suggested new all-time highs.

Bearish RSI Divergence, a Red Flag?

Under normal conditions, this bearish RSI divergence would be a serious red flag. However, the November 13 Profit Radar Report included the following observation:

The DJIA and Russell 2000 ended the week overbought, which normally will cause a pullback. However, if the S&P is truly in a wave 3 advance, stocks will continue to plow higher without much letup.”

The Russell 2000 has plowed higher ever since. The unique condition that allows for continuous gains despite on overbought condition is discussed here: S&P 500 Update – Expect the Abnormal?

Here is another statistic in favor of higher prices: Since 1979, there’ve been 12 other times when the R2K rallied at least 12 days in a row. A month later, the R2K was higher 10 times. 3 month later, the R2k was higher 7 times. 6 months later the R2k was higher 10 times.

The chart above provides long-term context for the R2K. The red trend line going back to 2011 is obvious resistance. If (and as long as) the R2K is able to sustain a break above this line, it may just continue higher.

Until it does, some caution is warranted.

Continuous updates for the Russell 2000, S&P 500 and other asset classes are available via the Profit Radar Report.

Simon Maierhofer is the founder of iSPYETF and the publisher of the Profit Radar Report. Barron’s rated iSPYETF as a “trader with a good track record” (click here for Barron’s profile of the Profit Radar Report). The Profit Radar Report presents complex market analysis (S&P 500, Dow Jones, gold, silver, euro and bonds) in an easy format. Technical analysis, sentiment indicators, seasonal patterns and common sense are all wrapped up into two or more easy-to-read weekly updates. All Profit Radar Report recommendations resulted in a 59.51% net gain in 2013, 17.59% in 2014, and 24.52% in 2015.

Follow Simon on Twitter @ iSPYETF or sign up for the FREE iSPYETF Newsletter to get actionable ETF trade ideas delivered for free.