Put/Call Ratio at Lowest Level of the Year

The CBOE equity put/call ratio fell to 0.53 yesterday, the lowest reading of 2015.

A ratio of 0.53 means that option traders bought 1.89 calls (bullish option bet) for every put (bearish option bet).

Put/call ratio extremes are generally a contrarian indicator.

Although it’s the lowest reading of the year, 0.53 is not extreme by historical standards.

The chart below plots the S&P 500 (NYSEArca: SPY) against the CBOE equity put/call ratio.

The dashed red lines highlight what happened the last three times the put/call ratio was around 0.53.


Nothing too scary happened.

In general, the put/call ratio needs to drop into the mid-40s to predict trouble with a measure of consistency.

Simon Maierhofer is the publisher of the Profit Radar Report. The Profit Radar Report presents complex market analysis (S&P 500, Dow Jones, gold, silver, euro and bonds) in an easy format. Technical analysis, sentiment indicators, seasonal patterns and common sense are all wrapped up into two or more easy-to-read weekly updates. All Profit Radar Report recommendations resulted in a 59.51% net gain in 2013 and 17.59% in 2014.

Follow Simon on Twitter @ iSPYETF or sign up for the FREE iSPYETF Newsletter to get actionable ETF trade ideas delivered for free.

IBB Biotech ETF Drops Into Oversold Territory

The iShares Nasdaq Biotechnology ETF (Nasdaq: IBB) lost as much as 15% since last Friday and is now at a rare short-term oversold level.

Over the last year, there were only four times the RSI 2 dropped below four. The vertical green lines highlight the prior instances. It led to a rebound every time.

The chart also shows strong support (various trend lines and 50-day SMA) just below current trade (330 – 333).

If history repeats itself, IBB should bounce here. But will this time be different?

Sunday’s Profit Radar Report spotted an ominous red candle high and warned that: “The iShares Nasdaq Biotechnology ETF (IBB) saw a high volume reversal (red candle) on Friday. Nothing epitomizes catching a falling knife like picking a biotech high, but this is a development worth watching for aggressive traders. The corresponding short biotech ETF is the ProShares UltraShort Biotech ETF (NYSEArca: BIS).”


This red candle high is still in play and volume really picked up during yesterday’s selloff (which could also be interpreted as washout decline).

Biotech shorts already pocketed nice gains, but as long as support holds, odds favor at least a bounce. Only a drop below will unlock further down side.

Simon Maierhofer is the publisher of the Profit Radar Report. The Profit Radar Report presents complex market analysis (S&P 500, Dow Jones, gold, silver, euro and bonds) in an easy format. Technical analysis, sentiment indicators, seasonal patterns and common sense are all wrapped up into two or more easy-to-read weekly updates. All Profit Radar Report recommendations resulted in a 59.51% net gain in 2013 and 17.59% in 2014.

Follow Simon on Twitter @ iSPYETF or sign up for the FREE iSPYETF Newsletter to get actionable ETF trade ideas delivered for free.

Bullish or Bearish? Dow Jones Averages are All Over the Place

All for one and one for all may have worked for the Three Musketeers, but it’s not working for the Dow Jones Averages.

All three Dow Jones Averages are pulling in different directions.

The Dow Jones Industrial is near its all-time high. The Dow Jones Utility just came off a nine-month low and the Dow Jones Transportation Average has been stuck in neutral for four months.

Here’s a look at all three averages and an attempt to interpret the meaning of the broad Dow Jones disharmony.

Dow Jones Utility Average (DJU)

The Dow Jones Utility Average (DJU) lost as much as 14% from January 28 to March 11.

On March 11, the Profit Radar Report noted that: “Utility stocks are down 13% from their recent high, and every stock component of the Utility Select Sector SPDR ETF (NYSEArca: XLU) is trading below its 50-day SMA. RSI is at a level that sparked rallies in June 2013 and August 2014. XLU trend line resistance is just below today’s close. Unlike XLU, the Dow Jones Utility Average already close below its trend line. Nevertheless, utility stocks are compressed and should soon spring higher.”

The latest rally started on March 12, and as long as support at 585 – 574 holds, DJU may continue higher.

Dow Jones Transportation Average (DJT)

The Dow Jones Transportation Average (DJT) has been stuck in a multi-month triangle, and is threatening to close below triangle support.

A break down below the ascending green trend lines has to be graded bearish (unless it reverses). Next support is at 8,800 and 8,600.

The iShares Transportation Average ETF (NYSEArca: IYT) tracks the DJT.

Dow Jones Industrial Average (DJI)

The Dow Jones Industrial Average (DJI) just fell below long-term Fibonacci support/resistance at 18,004, which is also where the 20-day SMA is.

This allows for continued weakness.

The SPDR Dow Jones Industrial Average ETF (NYSEArca: DIA) tracks the DJI.

Bearish Divergences?

The lack of confirmation among the Dow Average isn’t a bullish development, but thus far the key U.S. indexes are not displaying signs of a major market top (for more details about the indicator that’s identified the 1987, 2000 and 2007 tops go here: Is the S&P 500 Carving Out a Major Market Top?).

Until we get the same kind of deterioration seen at prior bull market highs, divergences among the Dow Average may just be a distraction.

Simon Maierhofer is the publisher of the Profit Radar Report. The Profit Radar Report presents complex market analysis (S&P 500, Dow Jones, gold, silver, euro and bonds) in an easy format. Technical analysis, sentiment indicators, seasonal patterns and common sense are all wrapped up into two or more easy-to-read weekly updates. All Profit Radar Report recommendations resulted in a 59.51% net gain in 2013 and 17.59% in 2014.

Follow Simon on Twitter @ iSPYETF or sign up for the FREE iSPYETF Newsletter to get actionable ETF trade ideas delivered for free.

I Spy … A Rare VIX Signal for the S&P 500

The 30-day VIX (VIX) is trading 23% lower than the 90-day VIX (VXV). This means VIX traders are less concerned about shorter-term (30-day) volatility than longer-term (90-day) volatility.

You may be thinking short-term complacency is a contrarian indicator … and you are right.

To provide a visual of short-term complacency, I’ve calculated the ratio between VIX and VXV and plotted it against the S&P 500.

For only the second time since April 2013, the VIX:VXV ratio dropped below 0.78 (view a long-term version of the VIX:VXV ratio chart here)

Prior sub 0.79 readings are highlighted with a dashed red line.


The conclusion is more or less self-explanatory.

This indicator has a pretty good track record and increases the odds of a S&P 500 (NYSEArca: SPY) pullback and VIX rise. Long VIX ETFs include the iPath S&P 500 Short-term VIX Futures ETN (NYSEArca: VXX) and VelocityShares Daily 2X ST VIX ETN (NYSEArca: TVIX).

Two things to keep in mind:

  • This is likely to be a short-term (3 – 10 days) trade.
  • In terms of risk management; a VIX close below support at 12.70 would temporarily (as long as it stays below 12.70) suspend the potential for a spike.

Simon Maierhofer is the publisher of the Profit Radar Report. The Profit Radar Report presents complex market analysis (S&P 500, Dow Jones, gold, silver, euro and bonds) in an easy format. Technical analysis, sentiment indicators, seasonal patterns and common sense are all wrapped up into two or more easy-to-read weekly updates. All Profit Radar Report recommendations resulted in a 59.51% net gain in 2013 and 17.59% in 2014.

Follow Simon on Twitter @ iSPYETF or sign up for the FREE iSPYETF Newsletter to get actionable ETF trade ideas delivered for free.

Next? A Crude Awakening for Oil Bears?

After losing 55% in a matter of six months, oil has been flat for the last two months. Is it gathering steam for the next big move?

A volatile bottoming process is nothing new for oil.

The 1986 and 2008/2009 bottoming processes were volatile as well (2008/2009 highlighted by blue circle). There were many weeks of wild up and down swings.

The initial low wasn’t violated in a meaningful way, but there was also no meaningful progress for about three months.

Based on the 1986 and 2008/2009 script, the February 4 Profit Radar Report anticipated wild, range bound swings.

The VIX for crude oil (OVX – light blue graph) is about at the same level as it was near the 2008/2009 low. If the 2008/2009 Oil VIX high acts as resistance, down side for oil is limited.

The dark blue graph shows the net futures position (Commitment of Traders Report) of commercial traders.


Although not extreme by historical standards, it appears that commercial traders are starting to prepare themselves for further gains.

Oil seasonality also suggests higher prices.

The red and green lines are long-term Fibonacci support/resistance, but probably more important is a trend line that’s been important for oil prices for nearly two decades (this proprietary trend line and detailed oil seasonality chart reserved for subscribers of the Profit Radar Report).

A move above this trend line is likely to trigger a rally.

Before investing in Oil ETFs like the United States Oil Fund (NYSEArca: USO) or iPath Crude Oil ETN (NYSEArca: OIL), investors should know that futures based ETFs (like USO and OIL) are subject to contango, and may lag the underlying asset (in this case oil).

Although this wasn’t the case in February 2015 – when oil prices and USO/OIL gained as much as 24.4% before reversing lower – it’s always good to calibrate expectations.

Simon Maierhofer is the publisher of the Profit Radar Report. The Profit Radar Report presents complex market analysis (S&P 500, Dow Jones, gold, silver, euro and bonds) in an easy format. Technical analysis, sentiment indicators, seasonal patterns and common sense are all wrapped up into two or more easy-to-read weekly updates. All Profit Radar Report recommendations resulted in a 59.51% net gain in 2013 and 17.59% in 2014.

Follow Simon on Twitter @ iSPYETF or sign up for the FREE iSPYETF Newsletter to get actionable ETF trade ideas delivered for free.

One Measure of Investor Optimism Hits Extreme Low

The latest American Association for Individual Investors (AAII) poll shows a significant drop in optimism.

Only 27.2% of individual investors are bullish on stocks. That’s the lowest reading since April 2013.

How powerful of a contrarian indicator is this?

The chart below plots the S&P 500 against the percentage of bullish AAII investors.

The dashed green lines mark bullish reactions to similar readings in the past, the red lines bearish reactions and the gray lines neutral (at least short-term) reactions.


Well, there are six prior instances with two bullish, two bearish and two neutral outcomes. Not much of an edge.

The AAII survey generally delivers noisy data and hardly ever works as a stand-alone contrarian indicator.

Compared with the many other investor sentiment gauges I follow, this reading stands out as a rogue extreme.

It’s one of those data points that should be taken with a grain of salt, but as long as the S&P 500 stays above 2,100, it shouldn’t be ignored either.

Simon Maierhofer is the publisher of the Profit Radar Report. The Profit Radar Report presents complex market analysis (S&P 500, Dow Jones, gold, silver, euro and bonds) in an easy format. Technical analysis, sentiment indicators, seasonal patterns and common sense are all wrapped up into two or more easy-to-read weekly updates. All Profit Radar Report recommendations resulted in a 59.51% net gain in 2013 and 17.59% in 2014.

Follow Simon on Twitter @ iSPYETF or sign up for the FREE iSPYETF Newsletter to get actionable ETF trade ideas delivered for free.

Small Caps Lead Market – Good or Bad Omen?

The Russell 2000 index of small cap stocks just pushed to new all-time highs.

Is this bullish for stocks?

To find out, I’ve plotted the S&P 500 against the IWM:IWB (small cap/large cap) ratio.

IWM is the iShares Russell 2000 ETF (NYSEarca: IWM). IWB is the iShares Russell 1000 ETF (NYSEArca: IWB).

Based on the ratio (currently at 1.06), the recent outperformance is by no means extreme.

What if we pretend for a moment that small cap outperformance was extreme (reading of 1.10 or greater)?

The red lines mark prior periods of small cap outperformance (IWM:IWB > 1.10). The S&P 500 (NYSEArca: SPY) couldn’t care less.

If anything, one could make an argument that extreme small cap underperformance works as buy signal. The dashed gray lines highlight readings smaller than 1.03.


The gray overlay of the iShares Russell 2000 Small Cap ETF (IWM), makes it clear that IWM is only trading 3% above where it was a year ago. The S&P 500 gained 13% since March 2014.

Small caps are often portrayed to be the engine that pulls the train (or at least the canary in the mine), but that’s not true.

We dispelled this myth in July when many jumped on the ‘small caps are down, the market’s going to crash’ bandwagon.

Perhaps recent small cap outperformance is a reflection of the idea that a strong dollar hurts multi-national large caps with overseas income more than small domestic companies.

But what happens if dollar strength takes a breather?

One more thought: Historically, small caps tend to under perform in the later stages of a bull market.

Simon Maierhofer is the publisher of the Profit Radar Report. The Profit Radar Report presents complex market analysis (S&P 500, Dow Jones, gold, silver, euro and bonds) in an easy format. Technical analysis, sentiment indicators, seasonal patterns and common sense are all wrapped up into two or more easy-to-read weekly updates. All Profit Radar Report recommendations resulted in a 59.51% net gain in 2013 and 17.59% in 2014.

Follow Simon on Twitter @ iSPYETF or sign up for the FREE iSPYETF Newsletter to get actionable ETF trade ideas delivered for free.

VIX Says: S&P 500 Traders Getting Too Callused

Please suffer with me through a somewhat boring but necessary 3-paragraph discussion on VIX vs volatility:

There’s a difference between volatility and VIX volatility. Volatility in general refers to rapid changes. For instance, someone may say: “Volatility will pick up around the Fed announcement.”

This may well be true, but increased volatility does not necessarily translate into higher VIX readings.

The VIX measures perceived risk. Perceived risk almost exclusively increases with falling prices. That’s why implied volatility (VIX) is susceptible to directional movement, not movement in general.

A VIX at 16, as the case right now, implies a 16% move (up or down) over the next 12 months (or 4.62% of the next 30 days).

Now we skip from VIX volatility to actual volatility. There are different ways to measure actual volatility; one way is Average True Range (ATR). ATR measures the trading range, in this case daily over 30 days.

The chart below plots the S&P 500 against ATR and the VIX. Something unique happened in January/February 2015.

S&P 500 trading got more violent and the ATR soared to 26 points. The VIX on the other hand stayed well below prior highs. In fact, it maintained a string of lower highs.

Is there anything we can learn from this, or is it just a piece of worthless academic research.

I actually think there are two noteworthy takeaways:

  1. Investors didn’t overact to the January/February correction. Throughout much of 2013 and 2014 even the smallest corrections (we are talking 5% or less) saw VIX spikes around 50%.

    This kind of panic triggers immediate bearish extremes, and limits the down side. The opposite is true for complacent responses. VIX complacency during selloffs allows for more down side and choppier trading activity.

  2. As the green trend line shows, the VIX has been sneaking higher, despite an relentless S&P 500 (NYSEArca: SPY) rally. Why is this significant?

    Bear markets do not start with the VIX at record lows! Again, bear markets do not start with the VIX at record lows!

    Back in July 2014, when the VIX was near 10, I wrote a special report (available to Profit Radar Report subscribers) titled “The VIX is too LOW for a Major Market Top.”

    The report pointed out a simple fact that was overlooked by all the experts calling for a market crash (just because the VIX was near 10):

    When the S&P 500 peaked in 2000 and 2007, the VIX wasn’t at its low. At the March 2000 high, the VIX was at 22. When the S&P topped in 2007, the VIX was at 16.

Based on the 2000 and 2007 pattern, the slow VIX ascent may actually be a longer-term warning sign.

My reliable ‘ultimate top indicator’ has not triggered a ‘major market top alert’ yet, but the sneaky VIX up trend seems to indicate we are inching closer, certainly closer than we were in the summer of 2014.

Simon Maierhofer is the publisher of the Profit Radar Report. The Profit Radar Report presents complex market analysis (S&P 500, Dow Jones, gold, silver, euro and bonds) in an easy format. Technical analysis, sentiment indicators, seasonal patterns and common sense are all wrapped up into two or more easy-to-read weekly updates. All Profit Radar Report recommendations resulted in a 59.51% net gain in 2013 and 17.59% in 2014.

Follow Simon on Twitter @ iSPYETF or sign up for the FREE iSPYETF Newsletter to get actionable ETF trade ideas delivered for free.

I Spy … The Most Insightful AAPL Chart

Apple is the most important stock on planet earth.

It’s the biggest component of the S&P 500 (NYSEArca: SPY) and Nasdaq (Nasdaq: QQQ). As of March 18, it will also be part of the Dow Jones, where it will rank as #6 of 30 (at least initially). Not bad for a “newcomer.”

The ebbs and flows of AAPL will affect almost every corner of the stock market universe.

When AAPL coughs, the market will get a cold. What are the odds of AAPL catching a cough?

Historical Dow Jones Curse

Historical data shows that inclusion into the prestigious Dow 30 club is more of a blessing than a course, at least short-term. 9 of the 15 components added since 1999 lost on average 6.3% within the first month.

Technical Blessing?

I invite you to inspect the AAPL chart with me.

Support: Green lines at 120 – 122.

Resistance: The chart only shows one red line, but there are actually two red lines (one going back almost 20 years) converging around 140. Prior to that, there’s black trend channel resistance around 132.

Interpretation: Although the brief spike above the black trend channel (accompanied by a bearish RSI divergence) could be a throw over top, I personally favor higher prices as long as AAPL stays above 120.

This is in conflict with the ‘Dow curse,’ but in harmony with AAPL seasonality (view AAPL seasonality chart here).

Sentiment may also support further AAPL gains, as the iWatch failed to garner much excitement (it’s easier to beat low expectations).

  • Bloomberg: Apple watch is a really poor product
  • MarketWatch: 3 reasons to think twice before buying Apple watch

Summary: Support at 120 – 122 deserves being watched closely. I favor further up side as long as support holds. However, a close below 120 cautions of a deeper correction.

Simon Maierhofer is the publisher of the Profit Radar ReportThe Profit Radar Report presents complex market analysis (S&P 500, Dow Jones, gold, silver, euro and bonds) in an easy format. Technical analysis, sentiment indicators, seasonal patterns and common sense are all wrapped up into two or more easy-to-read weekly updates. All Profit Radar Report recommendations resulted in a 59.51% net gain in 2013 and 17.59% in 2014.

Follow Simon on Twitter @ iSPYETF or sign up for the FREE iSPYETF Newsletter to get actionable ETF trade ideas delivered for free.

Short-term S&P 500 Forecast

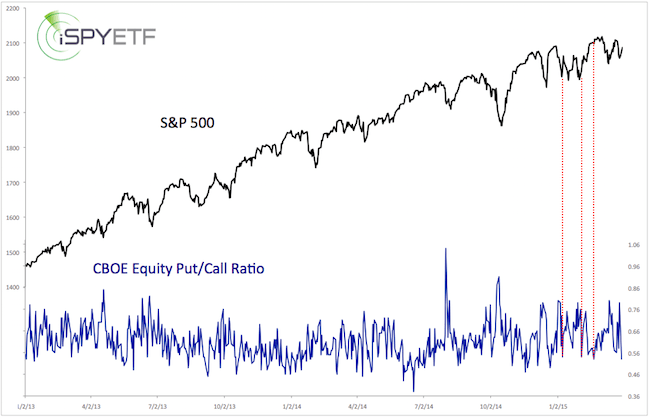
I invite you to inspect a very insightful S&P 500 chart with me.

Since February 2nd, the S&P 500 (NYSEArca: SPY) is tracing out a very symmetric pattern (see blue box and blue lines).

The only thing missing to complete a decline that mirrors the February 2 – February 25 rally is another leg down to 2,000.

Will the market complete the pattern?

Patterns like that can break apart at any time. I never rely on just one single pattern or indicator. Here’s what else the chart is telling us:

Prior support at 2,090 is now important resistance. On Friday, March 6, the Profit Radar Report recommended shorting the S&P as soon as 2,087 is violated.

Important support is around 2,040.

Wednesday’s Profit Radar Report highlighted the confluence of trend lines and observed that: “The S&P 500 is right about where a bounce becomes likely. The daily and hourly chart peg support around 2,040. There is a small bullish RSI divergence on the hourly chart. At a 1-3 day time frame, a (counter trend) bounce seems likely.”

Per a special intraday update, we closed our S&P short position already at 2,048 on Tuesday for a 39-point gain.

Based on the symmetrical pattern, resistance of the ‘left shoulder’ is around 2,072. There is also an open chart gap at 2,079. And of course there’s resistance at 2,090. This resistance cluster is illustrated via the red zone.

Supply & Demand

Selling pressure leading to Tuesday’s 2,040 low may have been enough to exhaust supply (Tuesday was almost a 90% down day), but buying pressure thus far (Thursday was only a 71% up day) is not indicative of a more lasting low.

Unless buying pressure picks up, and trade moves above 2,090, there’s still above average risk of a down side reversal towards 2,000 (especially if 2,040 gets broken).

The Profit Radar Report will continue to monitor proprietary measures of buying/selling pressure along with investor sentiment, divergences and support/resistance levels to stay ahead of the trend.

>> click here to test drive the Profit Radar Report with a 30-day money back guarantee.

Simon Maierhofer is the publisher of the Profit Radar Report. The Profit Radar Report presents complex market analysis (S&P 500, Dow Jones, gold, silver, euro and bonds) in an easy format. Technical analysis, sentiment indicators, seasonal patterns and common sense are all wrapped up into two or more easy-to-read weekly updates. All Profit Radar Report recommendations resulted in a 59.51% net gain in 2013 and 17.59% in 2014.

Follow Simon on Twitter @ iSPYETF or sign up for the FREE iSPYETF Newsletter to get actionable ETF trade ideas delivered for free.