Has the Crash Arrived?

Subscribers to iSPYETF’s free e-mail newsletter receive a market outlook, usually once a week. The market outlook below was sent out on December 15, 2022. If you’d like to sign up for the free e-newsletter, you may do so here (we will never share your e-mail with anyone, just as we don’t accept advertising).

Which 5-letter word grabs investors’ attention like no other?

Crash!

There’ve been a lot of crash warnings lately. Here is just a small sampling of headlines:

– This bear market rally could prompt a 2001-style crash

– As the reality of recession sinks in, prepare for market to crash

– Stock market crash: S&P 500 has 19% further downside

– Stock market crash warnings grow

– Stock market crash is coming even if US economy avoids recession

Most of the above headlines are already a few weeks old. Will today’s drop finally usher in the much anticipated crash?

Over the past few weeks I’ve been pointing out 3 things:

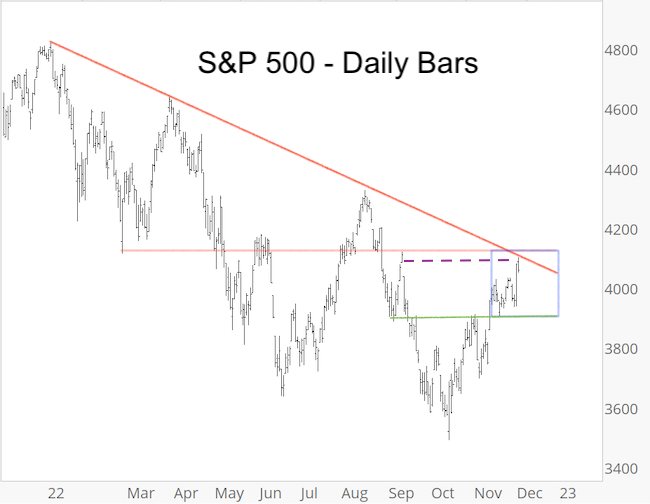
– There’s resistance (acting as inflection zone) around 4,100

– Support is around 3,900

– Market action could be choppy, but pullbacks should recover

You may recall my exact words from the November 13 Profit Radar Report:

“Chart gaps at 4,083.67 and 4,218.70 remain open. The next serious resistance zone is around 4,100. Short-term support is around 3,900. A pullback can happen any moment and price action may well be choppy in coming days/weeks, but odds of further gains following pullbacks are good.”

As the weekly chart shows, the S&P 500 tested resistance around 4,100 twice and is now – for the first time since November 10 – testing support around 3,900.

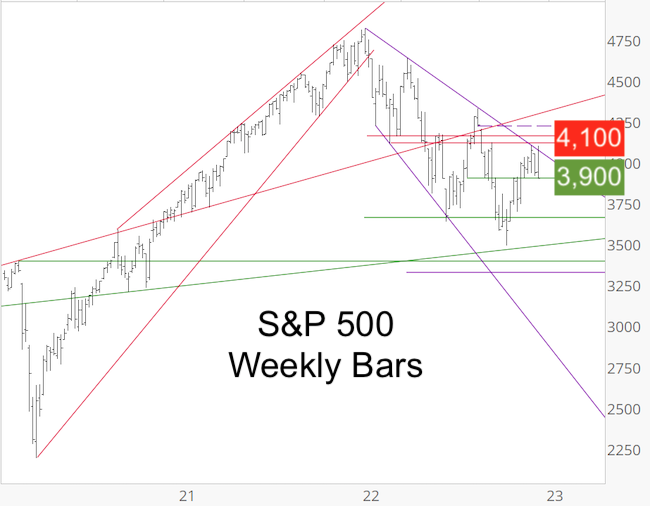
I’d like to point out that support around 3,900 has become quite obvious, which makes a seesaw across it more likely, and today’s drop created another chart gap at 3,965.65 which should be closed in the not so distant future.

To sum up: The S&P 500 met resistance around 4,100 and reacted (first step of a reversal). The S&P is now testing support around 3,900 (potential second step of confirming reversal).

Although price is currently just below 3,900, I wouldn’t consider this as second step to confirming a bearish reversal yet (due to seesaw risk).

Nevertheless, any potentially bullish patterns (or “odds of further gains”) are on hold and more down side is possible as long as price stays below 3,900.

At this point, the decline from Tuesday’s high looks like 3 waves. According to Elliott Wave Theory a 5-wave decline is needed to start confirming a trend change.

Continued updates and purely fact based research are available via the Profit Radar Report

The Profit Radar Report comes with a 30-day money back guarantee, but fair warning: 90% of users stay on beyond 30 days.

Barron’s rates iSPYETF a “trader with a good track record,” and Investor’s Business Daily writes “Simon says and the market is playing along.”

S&P 500 on Schedule into Inflection Zone


Subscribers to iSPYETF’s free e-mail newsletter receive a market outlook, usually once a week. The market outlook below was sent out on December 1, 2022. If you’d like to sign up for the free e-newsletter, you may do so here (we will never share your e-mail with anyone, just as we don’t accept advertising).

It’s been a while since the last Free Market update, but no updates were required as the market continues to follow my ‘keep it simple’ blueprint (almost like painting by numbers).

The complexity of current world events confuses many analysts and investors. I try to ‘de-confuse’ and simplify this incredibly complex environment … and the market is allowing me to do this (it’s not always this way).

The November 13, Profit Radar Report outlined our most recent ‘keep it simple’ blueprint:

Chart gaps at 4,083.67 and 4,218.70 remain open. The next serious resistance zone is around 4,100. Short-term support is around 3,900. A pullback can happen any moment and price action may well be choppy in coming days/weeks, but odds of further gains following pullbacks are good.”

The blue box pinpoints the price action since November 13. Within a choppy environment, the S&P 500 first tested support around 3,900 and today closed the open chart gap (dashed purple line) at 4,083.67. Resistance around 4,100 is just ahead.

What caused this rally to 4,100? “Seasonality and the weight of evidence favor higher prices, which is our base assumption,” is what I told subscribers weeks ago.

There was also an absolute investor sentiment oddity, which I first pointed out in the November 9, Profit Radar Report: “According to the CBOE, the equity put/call ratio soared to 1.30 yesterday, which is an absolute panic reading that even exceeds the COVID extreme. If this data is correct, it should be a positive for price.”

The fifth graph in the chart below shows the bullish (for stocks) put/call ratio extreme, which means that option traders panicked more in the second half of November than at the 2020 meltdown low. Hard to believe, but that’s the CBOE data. The spike in the CBOE SKEW (blue graph) sent a similar message.

What’s next though?

The weight of evidence and seasonality are still supportive of higher prices, but something changed: The S&P 500 has now reached an important resistance and inflection zone.

This is a price zone where risk management takes on a more important role and prudent investors should consider reducing exposure or setting stop-losses below support.

Inflection zones are like traffic lights, they don’t have to be red, but if a car is going to have to stop, it’s likely at a traffic light.

King dollar … de-crowned?

Since September 28, when the US Dollar Index hit a 20+ year high, the USD dropped from 114.7 to 105. On that day, September 28, I happened to share the following chart and warning via the Profit Radar Report:

The US Dollar Index has been on a tear, rising almost vertically. Normally I would draw ‘bowl’ support (previously used to predict major drops for TSLA and Bitcoin, see January 10, 2021 PRR), but currencies are prone to trend longer than equities. For this reason, the USD should be given a longer leash, but the parabolic rise combined with trend channel resistance suggests that at minimum a temporary pause and/or pullback is getting close and chasing the USD carries a fair amount of risk.”

Price got repelled by one trend channel and is now also trading below the other trend channel (currently at 107.5). This is now resistance and as long as price stays below resistance it can continue to work lower.

We live in uncertain, complex and confusing times. Get access to straight-forward, purely fact based research, and become the best-informed investor you know! Sign up for the Profit Radar Report

The Profit Radar Report comes with a 30-day money back guarantee, but fair warning: 90% of users stay on beyond 30 days.

Barron’s rates iSPYETF a “trader with a good track record,” and Investor’s Business Daily writes “Simon says and the market is playing along.”