Different year, same path. Below is a S&P 500 comparison between the first 18 trading days of 2020 and 2021.
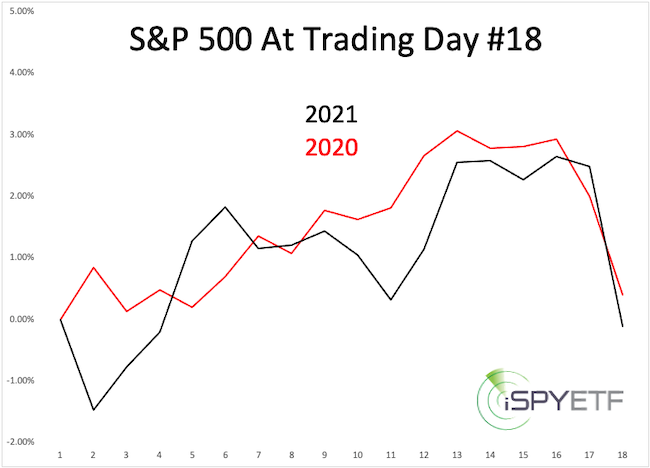
It’s probably no coincidence that both years started with an epic tug-of-war. The tug-of-war leading into January 2020 was described here and the tug-of-war leading into 2021 was described here.
This seems like a crazy question, but based on the eery January similarity, one worth asking:
What are the odds of 2021 being a 2020 replay?
There are different ways of looking at this. 1) Based on historical precedents and 2) Based on the most recent developments.
Historical Precedents
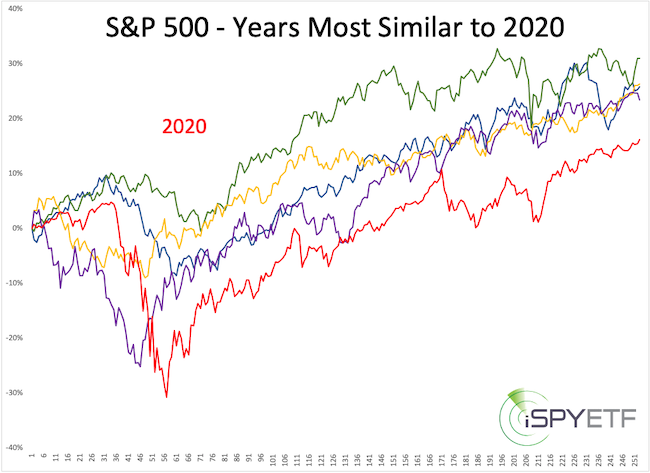
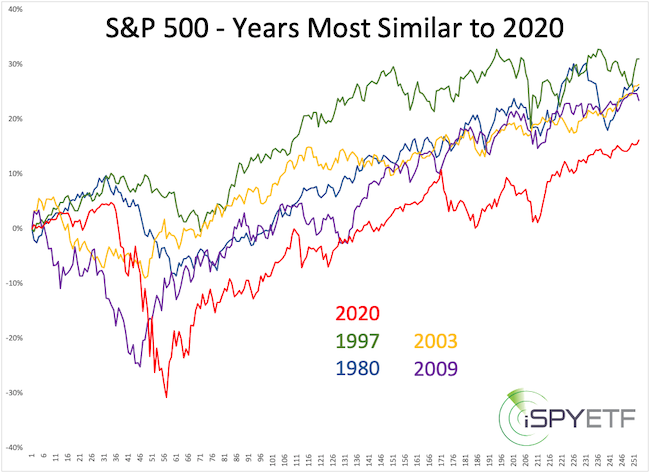
Shown below is the S&P 500 performance of the years that most closely resemble the path of 2020. No doubt 2020 was more extreme than any other year, but the general trajectory of 1980, 1997, 2003, 2009 was pretty darn close that that of 2020.
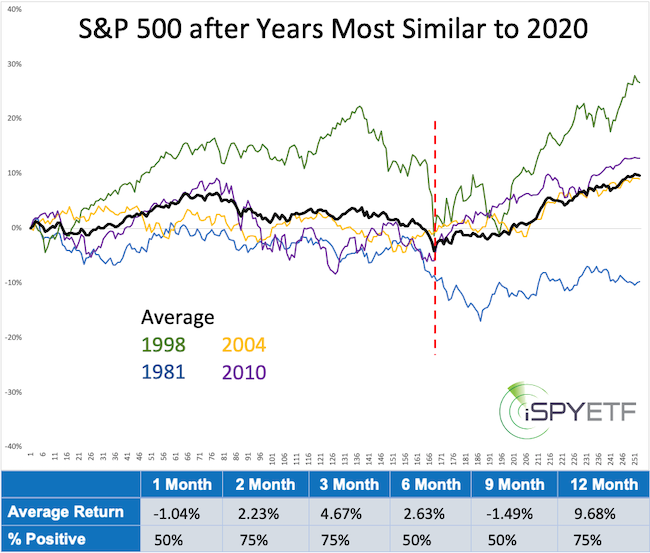
Here is where it gets interesting: The next chart shows the performance of the years that followed: 1981, 1998, 2004, 2010. Here are two key takeaways:
If you enjoy quality, hand-crafted research, sign up for the FREE iSPYETF e-newsletter & market outlook
- There was no repeat of the prior year’s path
- Any gains were given up by August
Most Recent Developments
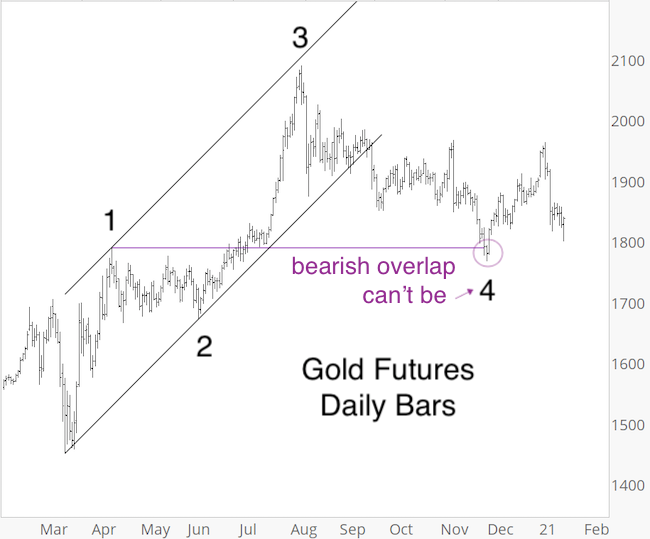
Sunday’s (January 24) Profit Radar Report featured the chart below and warned that: “The S&P 500 is at double trend channel resistance and the 138.2% projection level mentioned in the 2021 S&P 500 Forecast. There are RSI-35 divergences at multiple degrees and the cumulative NY Composite a/d line did not confirm Thursday’s all-time high. Stocks are near an inflection zone that could spark a pullback. For the S&P 500, that inflection/resistance zone is 3,850 – 3,880.”
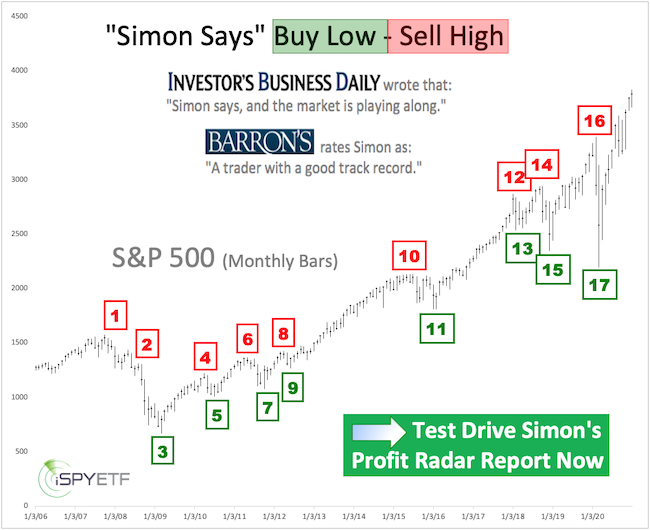
Barron’s rates iSPYETF as “trader with a good track record” and Investor’s Business Daily says: “When Simon says, the market listens.” Find out why Barron’s and IBD endorse Simon Maierhofer’s Profit Radar Report
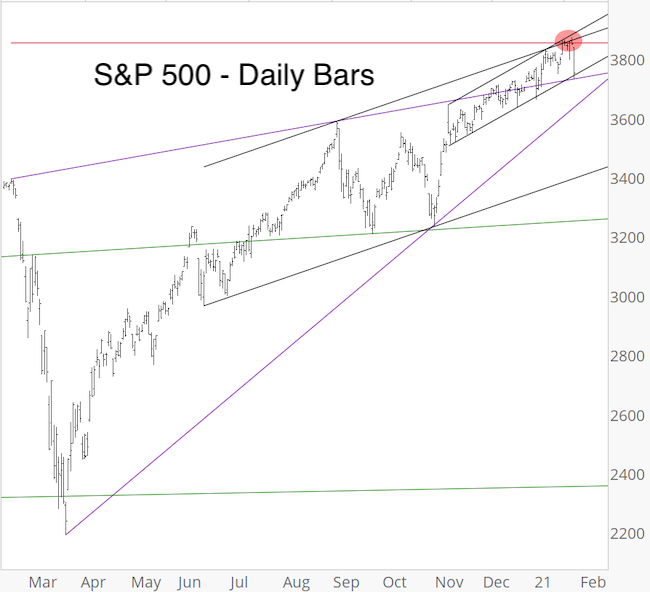
One swallow doesn’t make a summer, and one down day doesn’t make a bear market. Tuesday was a big down down day, one that ‘came just in time’ and erased 3 weeks of gains for the S&P 500, but it wasn’t more then that. Not yet.
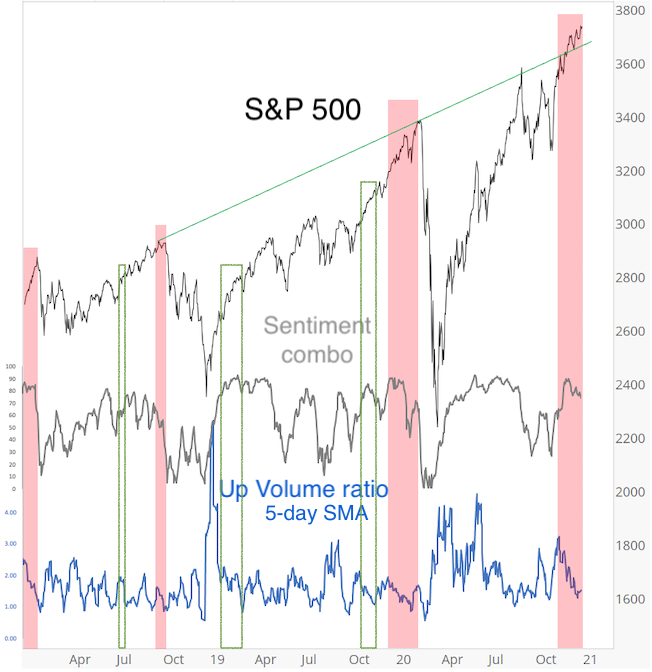
Based on the sentiment extremes seen in December and January, the down side potential is much greater, but it will take a break below the two purple wedge lines to do some actual chart damage.
Yesterday’s Profit Radar Report stated that: “Today’s drop pulled the S&P 500 into a key support zone. RSI-2 is almost over-sold, so a bounce is possible. The weight of evidence, however, suggests more risk ahead, with or without bounce. A break below 3,725 – 3,650 is needed for bears to gain the upper hand.“
Summary
Historically, a replay of the 2020 path in 2021 is very unlikely. But the extreme hopium building up in recent weeks makes a bigger correction likely, and the positive breadth readings throughout 2020 suggest a cameback after a correction.
In short, a full 2020 replay is unlikely, but a drop below purple wedge support could spark a nasty drop and subsequent snap back rally, which is the ‘mini-me’ version of what happened in 2020.
Continuous updates are available via the Profit Radar Report.
Simon Maierhofer is the founder of iSPYETF and the publisher of the Profit Radar Report. Barron’s rated iSPYETF as a “trader with a good track record” (click here for Barron’s evaluation of the Profit Radar Report). The Profit Radar Report presents complex market analysis (S&P 500, Dow Jones, gold, silver, euro and bonds) in an easy format. Technical analysis, sentiment indicators, seasonal patterns and common sense are all wrapped up into two or more easy-to-read weekly updates.
Follow Simon on Twitter @iSPYETF or sign up for the FREE iSPYETF e-Newsletter to get actionable ETF trade ideas delivered for free.
If you enjoy quality, hand-crafted research, sign up for the FREE iSPYETF e-newsletter & market outlook