We’ve had a number of good trades in 2016. In fact, only 1 of 7 trades was closed in the red.
It’s tempting to label our S&P 500 trade (bought at 1,828, sold at 2,040) the best trade of 2016 (thus far).
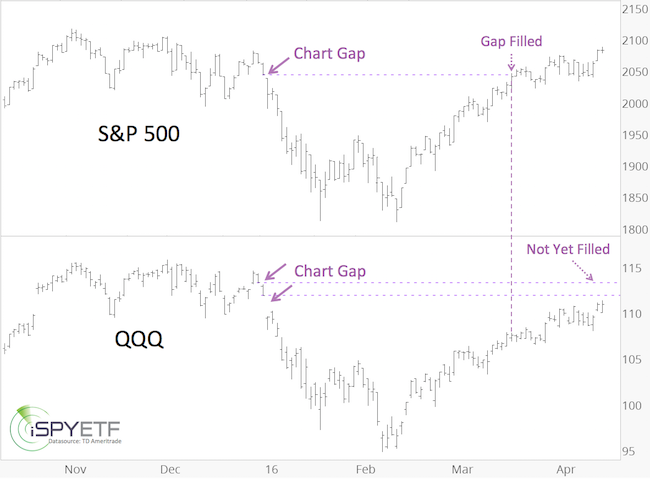
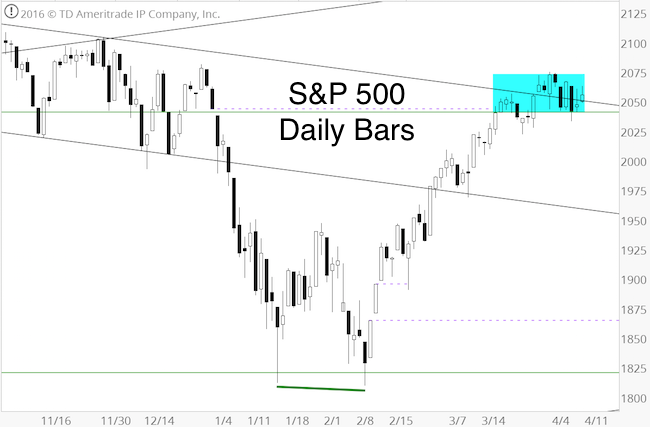
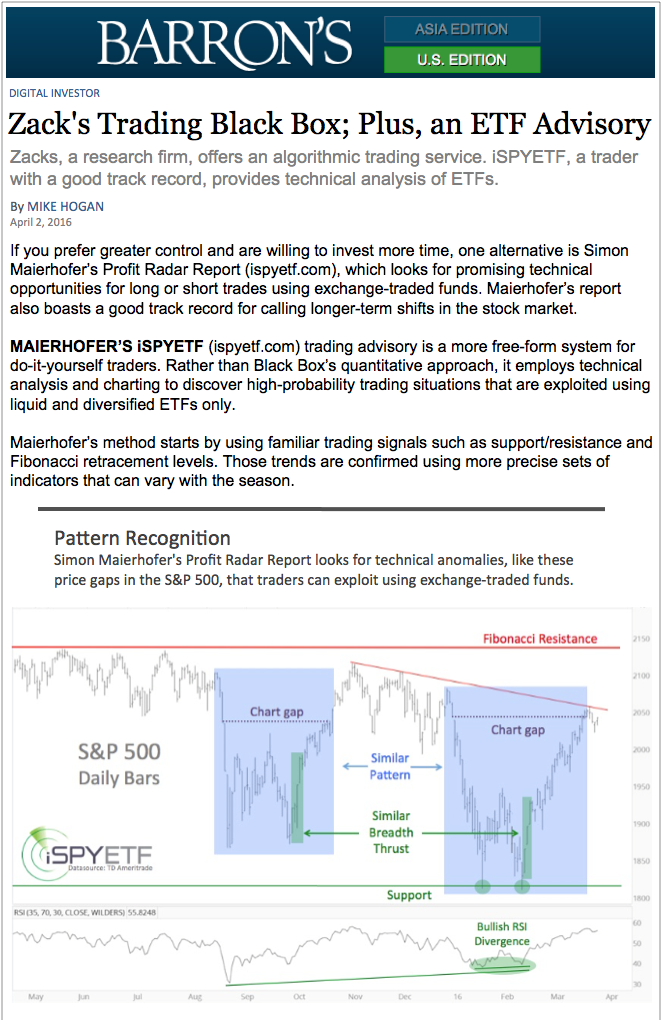
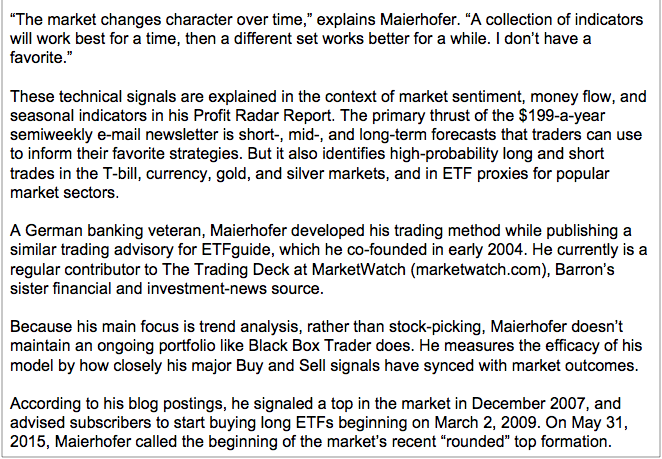
Barron’s rates the iSPYETF as a “trader with a good track record.” Click here for Barron’s assessment of the Profit Radar Report.
True, the S&P 500 trade was the most contrarian trade of them all. It required a fair amount of moxie to go against the crowd.
But the best trade was a rare ‘high probability trade.’
The March 6 Profit Radar Report observed the following setup:
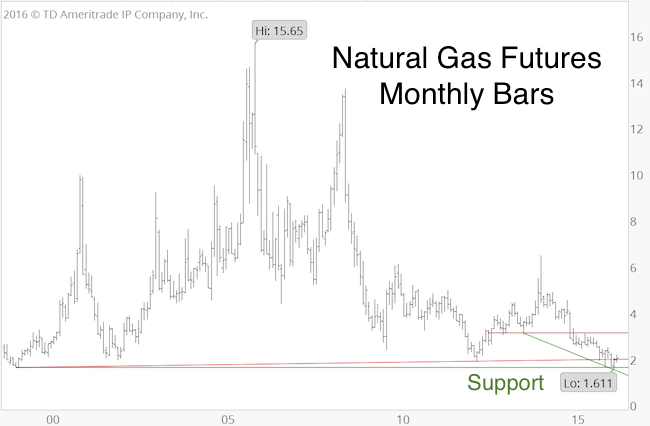
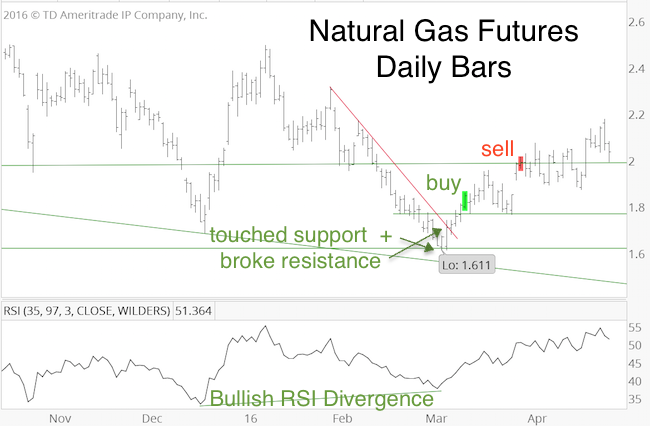
“Natural gas futures fell to a multi-decade low ($1.611 per one million British Thermal Units – BTU).Sentiment is very bearish (bullish for gas) and seasonality is turning bullish. Trade is at or near support and there is a bullish divergence on the daily chart. This is shaping up for a rare high probability trade. We are looking for a low-risk entry point.”
The monthly bar chart shows a birds eye view of the setup.
The daily chart shows a bullish RSI divergence and the touch of double support.
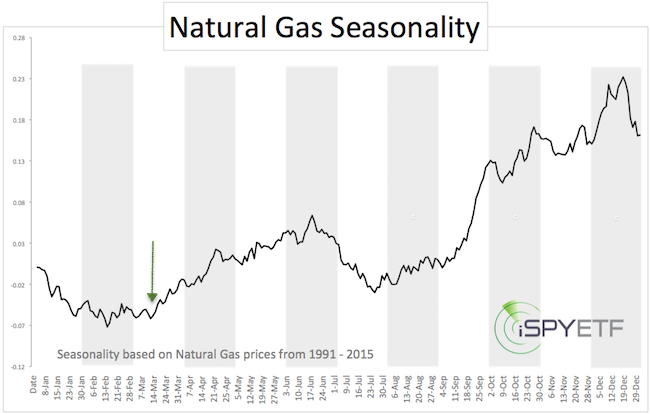
Natural gas seasonality turned bullish in early March.
Some measures of investor sentiment were at or near bearish (bullish for gas) extremes.
Technicals, sentiment, and seasonality all pointed in the same direction (up). The pieces for a high probability buy signal were in place.
We bought on March 10, after trade poked above the initial red resistance line. We sold on March 30, when trade was overbought and against resistance.
The profit was about 14% for natural gas futures and about 9% for the related ETF (UNG) trade (corresponding commodity ETF returns tend to be lower due to contango).
Based on seasonality, there is more up side for natural gas, but the probability of further gains is not as high as it was in early March.
The Profit Radar Report is always on the prowl for rare high probability trades.
Simon Maierhofer is the founder of iSPYETF and the publisher of the Profit Radar Report. Barron’s rated iSPYETF as a “trader with a good track record” (click here for Barron’s profile of the Profit Radar Report). The Profit Radar Report presents complex market analysis (S&P 500, Dow Jones, gold, silver, euro and bonds) in an easy format. Technical analysis, sentiment indicators, seasonal patterns and common sense are all wrapped up into two or more easy-to-read weekly updates. All Profit Radar Report recommendations resulted in a 59.51% net gain in 2013, 17.59% in 2014, and 24.52% in 2015.
Follow Simon on Twitter @ iSPYETF or sign up for the FREE iSPYETF Newsletter to get actionable ETF trade ideas delivered for free.