Subscribers to iSPYETF’s free e-mail newsletter receive a market outlook, usually once a week. The market outlook below was sent out on August 26. If you’d like to sign up for the free e-newsletter, you may do so here (we will never share your e-mail with anyone, just as we don’t accept advertising).
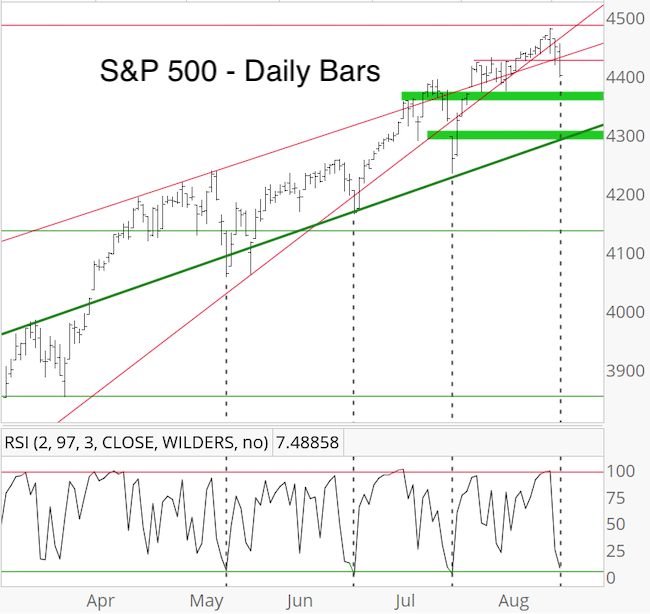
Stocks actually pulled back a bit last week, but last Wednesday’s Profit Radar Report showed the chart below (price has been updated) and stated the following (the chart was also included in last week’s Market Outlook):
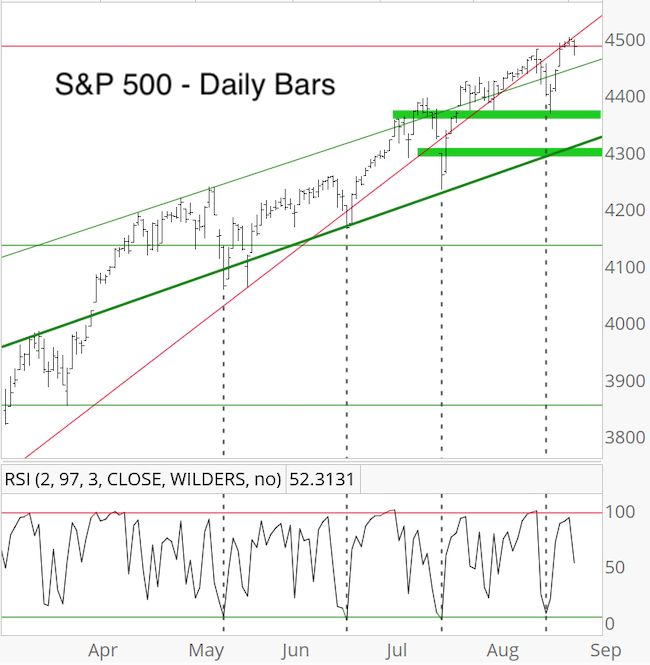
“On Monday, the S&P made it as high as 4,480.26 and has fallen below some minor support levels since. RSI-2 is now over-sold, which has marked the end of any pullback since May (dashed gray lines). Since the 4,485 target was not fully met, the market has still the option to reach and perhaps briefly exceed it.“
While the bounce to tag our target around 4,485 was not unexpected, I was surprised to see such oomph behind that move.
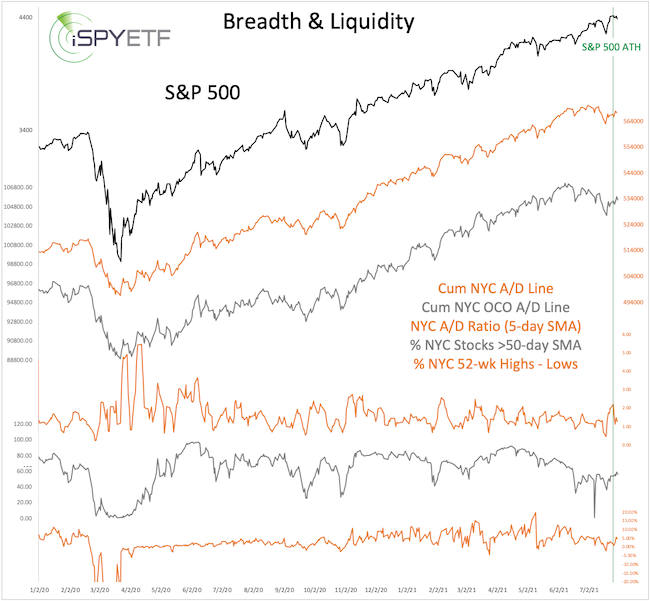
On Friday, Monday, Tuesday (3 consecutive days), more than 68% of NYSE-traded stocks advanced and, more noteworthy, more than 75% of volume flowed into advancing stocks all 3 days.
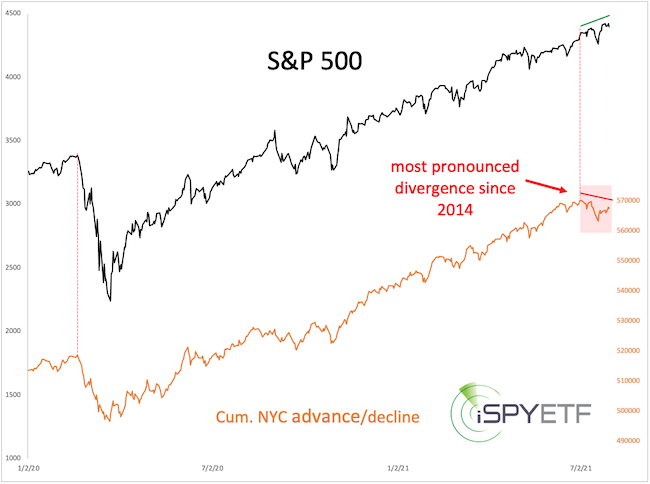
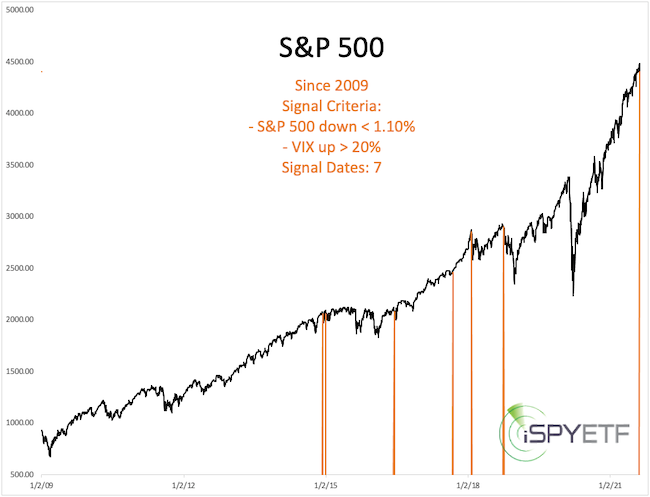
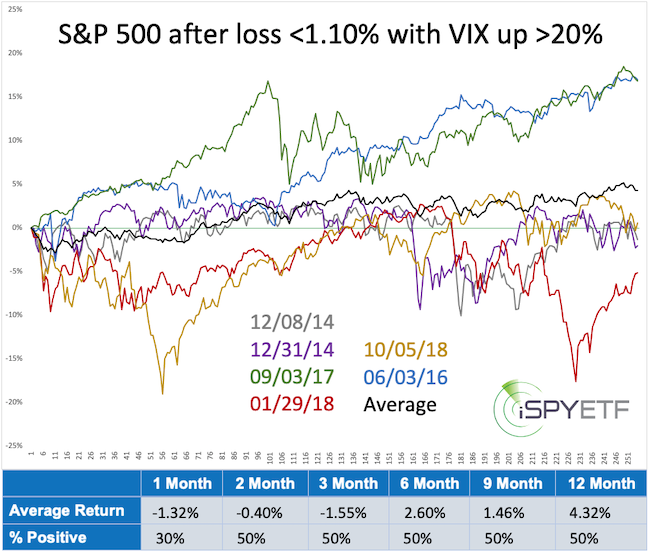
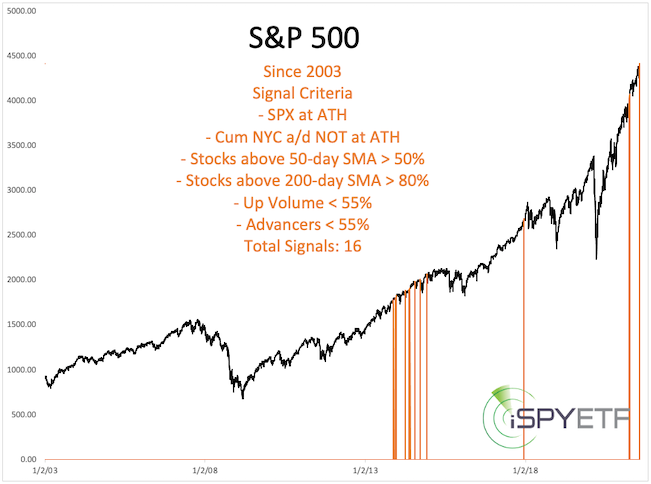
The chart below highlights the 10 other days (since 2003) when the S&P 500 rallied into an all-time high, while a bearish NY Composite advance/decline divergence exists, with the 3-day SMA of up volume and advancers >77% and >70%. This has been bullish since the 2020 low, but a bit more mixed prior to that.
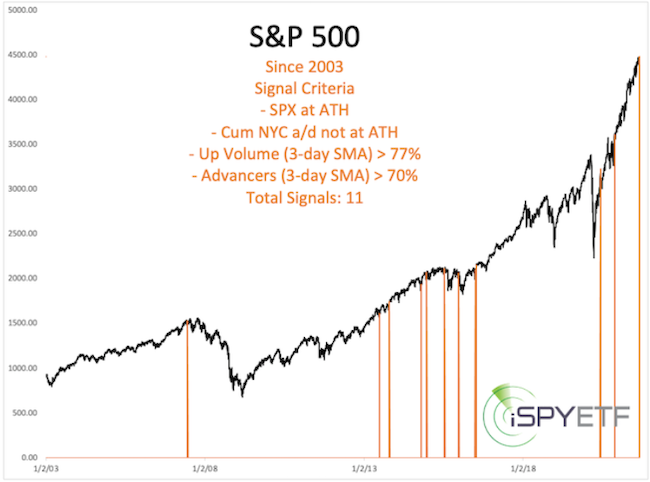
In my opinion, this mini breadth trust neutralizes some of the bearish divergences reported recently.
Nevertheless, my Risk/Reward Heat Map still projects risk for August/September, the up side target has been met, a small 5-wave rally may have concluded. At minimum a brief pullback is likely (such as today), but it still will take a break below support to dent the bull market.
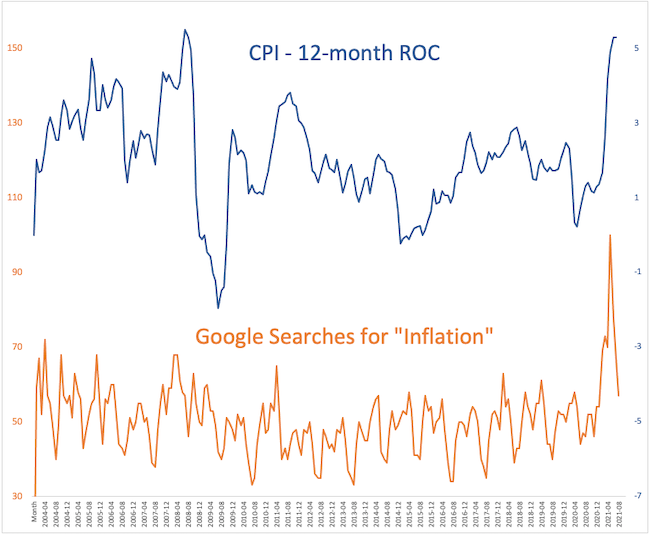
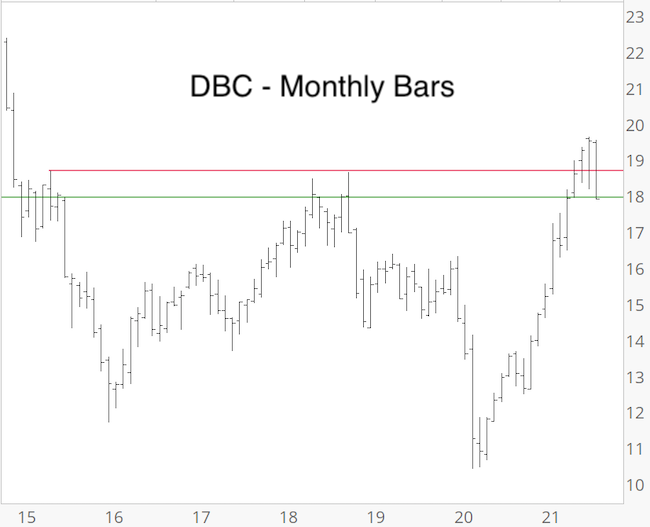
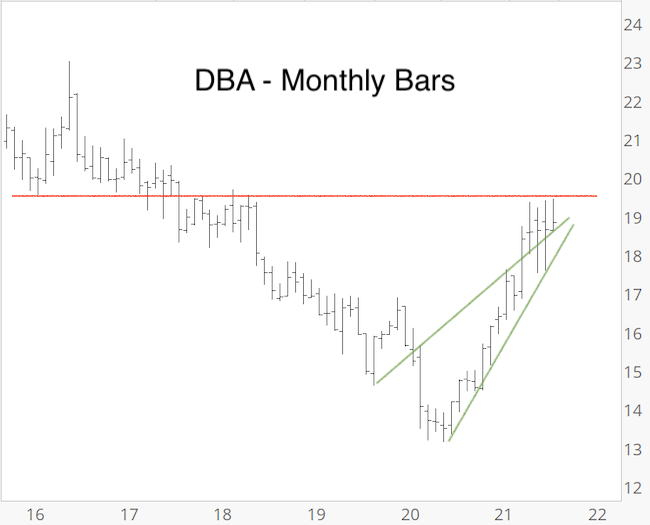
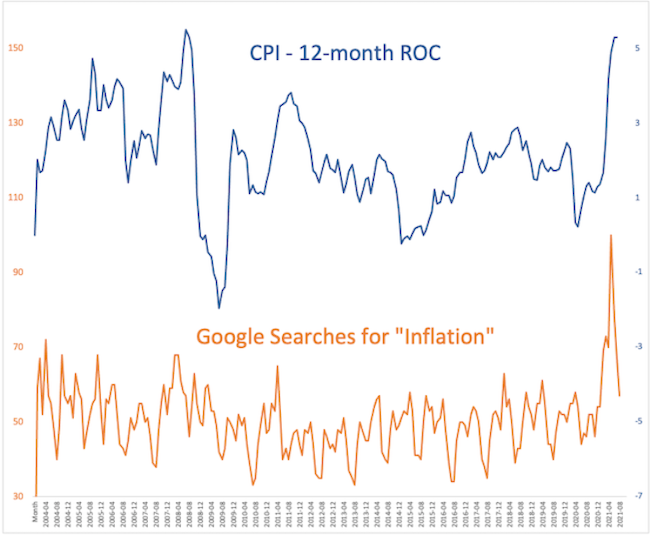
Below is just a quick glance at some inflation metrics. What they mean for consumers and investors and how to hedge against inflation is discussed here: How Bad is Inflation?
The August 8 Profit Radar Report featured the gold chart above and stated that:
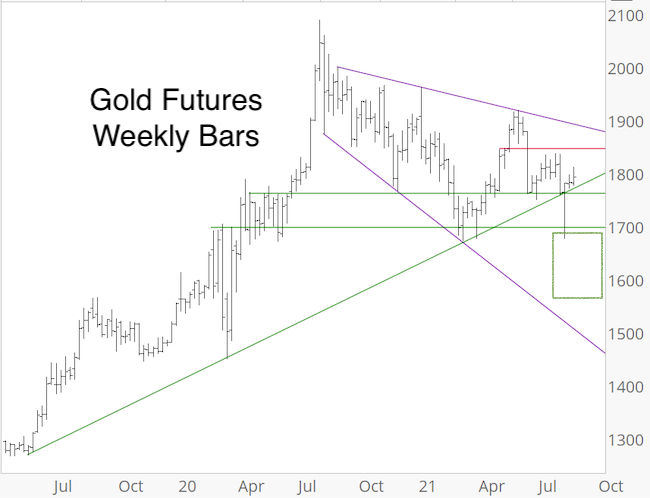
“If gold reaches the green target box, the decline from the August high could be counted as 5 waves, which would clarify the longer-term picture and set up some better trading opportunities (i.e. buy in the target range).”
Within hours of that update, gold tumbled 5%, touched the upper end of the target box, and bounced back. It all happened overnight. The rally from the low appears to have traced out 5 waves, which suggests another (brief) pullback before a more sustainable advance.
Continued updates, out-of-the box analysis and forward performance based on historic precedents are available via the Profit Radar Report.
The Profit Radar Report comes with a 30-day money back guarantee, but fair warning: 90% of users stay on beyond 30 days.
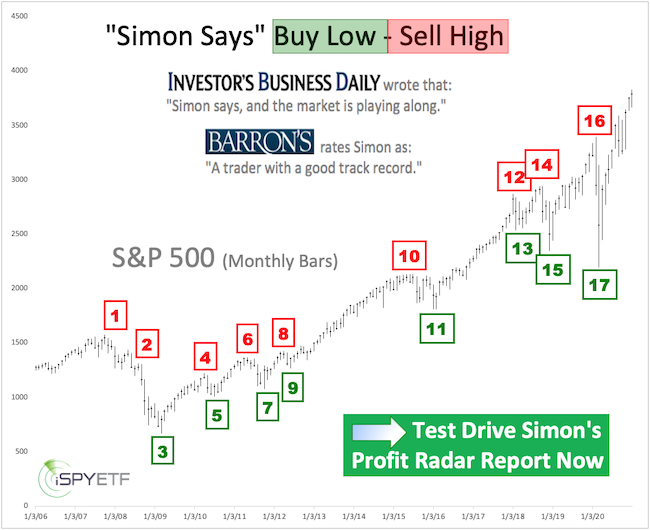
Barron’s rates iSPYETF a “trader with a good track record,” and Investor’s Business Daily writes “Simon says and the market is playing along.