Subscribers to iSPYETF’s free e-mail newsletter receive a market outlook, usually once a week. The market outlook below was sent out on February 16, 2023. If you’d like to sign up for the free e-newsletter, you may do so here (we will never share your e-mail with anyone, just as we don’t accept advertising).
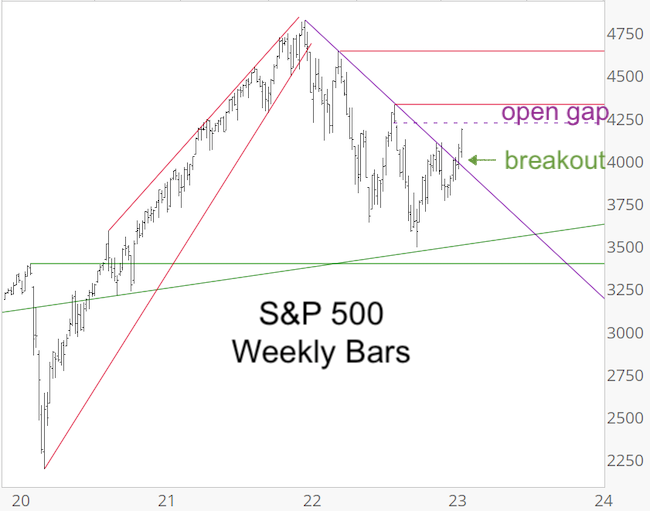
The last Market Outlook discussed the S&P 500 breakout, which was good for 200 points … before fizzling. What happened?
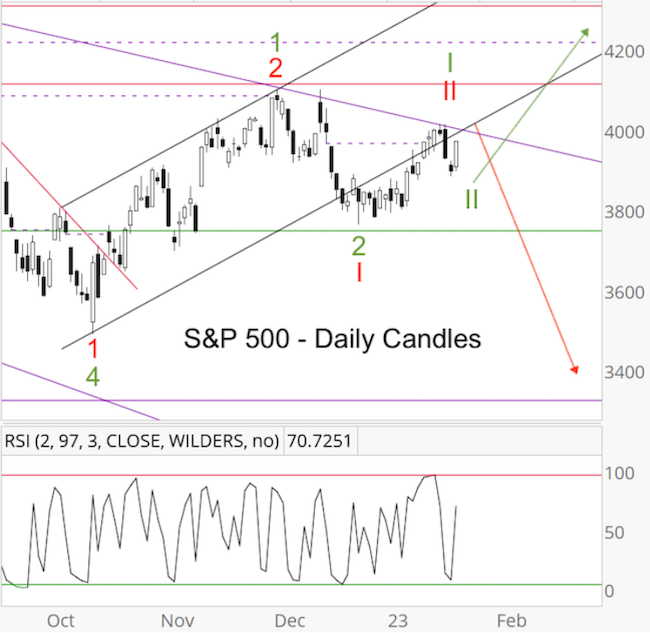
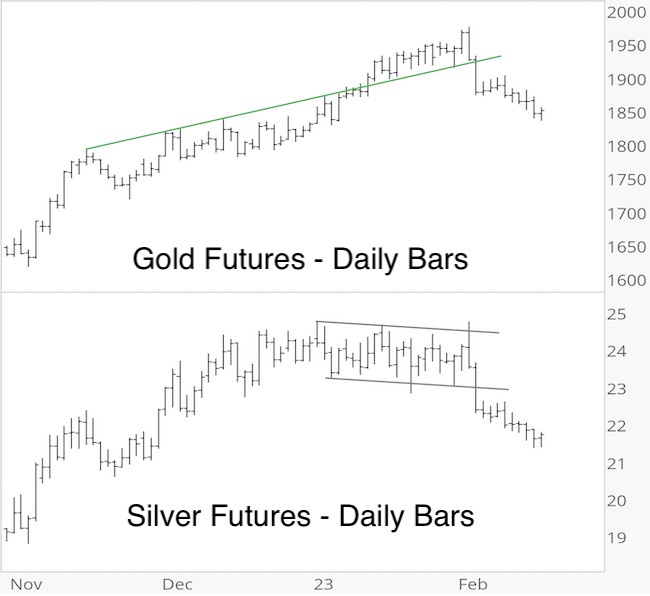
Via the February 1, Profit Radar Report, I pointed out a wedge (purple lines) and that a break below the wedge would caution the rally is due to pause.
The chart below shows the longer-term breakout above the green trend line. The chart insert zooms in on the wedge following the breakout.
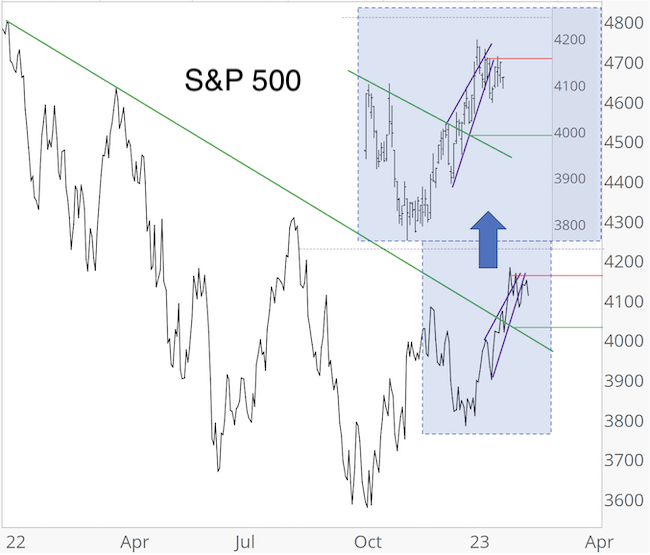
In short, the potential for a bearish wedge conflicted with the breakout follow through.
As the chart (especially insert) shows, the S&P 500 broke below the purple wedge on February 9. What does that mean?
“The S&P 500 broke below wedge support, which allows for lower prices. The weight of evidence suggests an eventual rebound, but as long as below 4,160 it’s prudent to allow down side to develop” (February 12, Profit Radar Report).
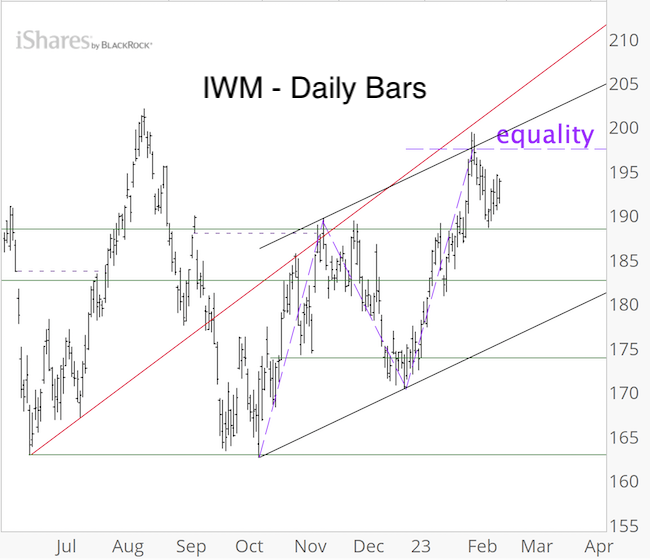
The situation becomes clearer when looking at the IWM (Russell 2000 Index of small cap stocks) chart.
Resistance at 197.60 and 200 was mentioned in the February 1 and 5, Profit Radar Reports along with this comment:
“That resistance is comprised of the trend channel, trend line, and equality between 2 of the 3 legs coming off the October low. A reaction at this level is normal. A number of recent studies suggest stocks will ultimately work their way higher, but IWM did reach an inflection zone that at minimum allows for a deeper pullback.”
Summary: The S&P 500 is below support, which allows for lower prices. However, a majority of my studies and indicators suggest higher prices (two studies conducted last week have a historic success rate of 100%). Unless there’s a break below support, higher prices deserve the benefit of doubt.
Gold and silver were taken behind the woodshed for a beating. Hopefully that wasn’t a surprise for you.
Silver’s refusal to confirm gold’s January high suggested risk for both metals.
I published the chart below in the January 25, Profit Radar Report and warned: “Gold continues to grind higher as silver moves sideways without taking out its prior highs. While above 1,905 gold can continue to grind higher, but risk appears elevated, especially while silver stays below its prior reaction high.“
In terms of Elliott Wave pattern, the gold chart allowed for two diametrically opposed interpretations. Despite being total opposites, they had one thing in common. A sizable short-term drop.
I showed the chart below in the January 22, Profit Radar Report and warned that: “both options have a near-term pullback in common.”
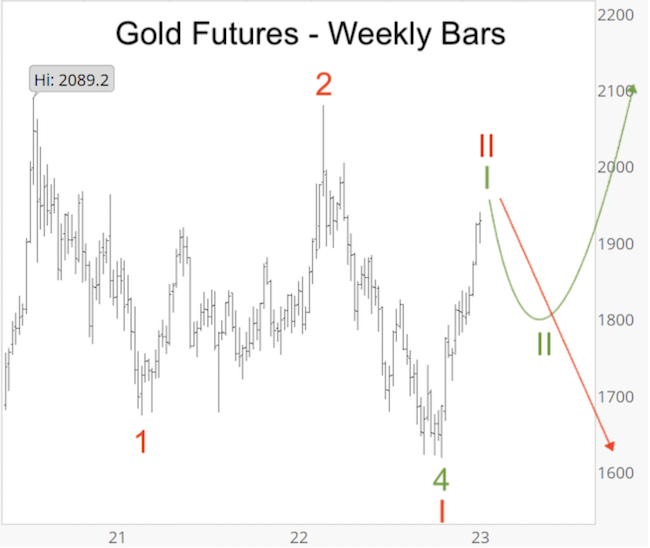
Since then, gold has dropped from 1,975 to 1,836. This may meet the minimum requirement for a wave 2 pullback (green projection), but cycles and seasonality suggest that we should see further weakness.
Continuous updates for the S&P 500, gold, silver and other assets are available via the Profit Radar Report.
Not convinced yet? Now is a good time to find out what’s ahead for 2023.
2023 S&P 500 Forecast
The 2023 S&P 500 is now available! It includes 24 charts and covers the following indicators and topics:
– 2022 Review
– Supply & Demand, Breadth
– Support/Resistance Levels
– Elliott Wave Theory
– Inflation
– Socioeconomic Peace & Prosperity
– Investor Sentiment
– Seasonality & Cycles
– S&P 500 Barometers
– Valuations
– Money Flow
– Risk/Reward Heat Map
– Summary
– 2023 S&P 500 Projection
Some of the discussed indicators come with a 90% and 95% accuracy track record. All indicators and data points are combined into one forward projection (the S&P 500 is tracking it well thus far).
Below is last year’s projection compared to the actual S&P 500 performance.
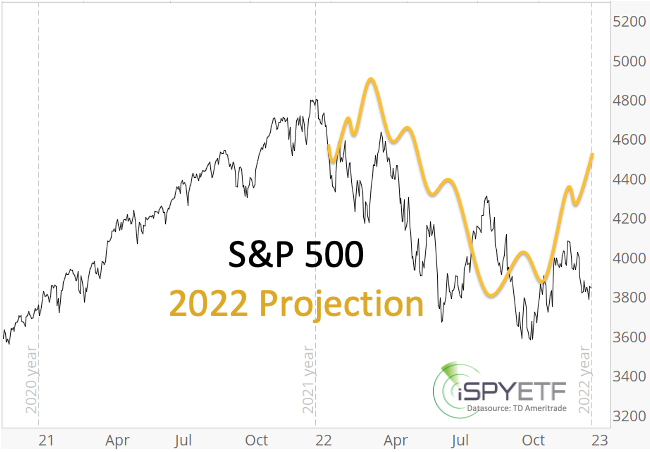
The full 2022 S&P 500 Forecast is available here for your review.
Below are some of the warning signs mentioned in the 2022 S&P 500 Forecast BEFORE the stock market fell into a pothole:
– “The bearish divergence (NY Composite a/d lines) reappeared again at the January 2022 S&P 500 highs. This internal market deterioration is a concern and a warning sign.”
– “The 6-month average of Titanic signals exceeded 25. It’s been a good bear market indicator. Although the majority of breadth studies are positive, this is one that should not be ignored.”
– “We’ll focus on the commonality of all 3 (Elliott Wave Theory) scenarios: Up side is limited and down side risk is increasing.”
– “Trend line resistance is around 4,915. We do not expect the S&P to break above this trend line in 2022.”
– “Short-term, the January 10, 2022 low at 4,582 is important. Failure to hold above this level would be a warning signal with the potential for a quick drop into the 4,200 – 4,300 range. If the 4,200 – 4,300 support zone fails, a test of the 4,000 zone (as low as 3,700) is possible.”
– “2022 is the mid election year, which is the weakest of the 4-year presidential election year cycle. Historically (going back to 1950), the S&P 500 declines on average about 20% into the mid-term election year low.”
– “Since the Fed is planning to unwind and reduce purchases (and shrink its balance sheet) in 2022, the risk of a more serious correction this year is much greater than in 2021.”
To receive the 2023 S&P 500 Forecast and for continued updates and purely fact based research, sign up for the
Continued updates and factual out-of-the box analysis are available via the Profit Radar Report.
The Profit Radar Report comes with a 30-day money back guarantee, but fair warning: 90% of users stay on beyond 30 days.
Barron’s rates iSPYETF a “trader with a good track record,” and Investor’s Business Daily writes “Simon says and the market is playing along.”