Gotcha! Stocks Did it Again

Subscribers to iSPYETF’s free e-mail newsletter receive a market outlook, usually once a week. The market outlook below was sent out on September 23. If you’d like to sign up for the free e-newsletter, you may do so here (we will never share your e-mail with anyone, just as we don’t accept advertising).

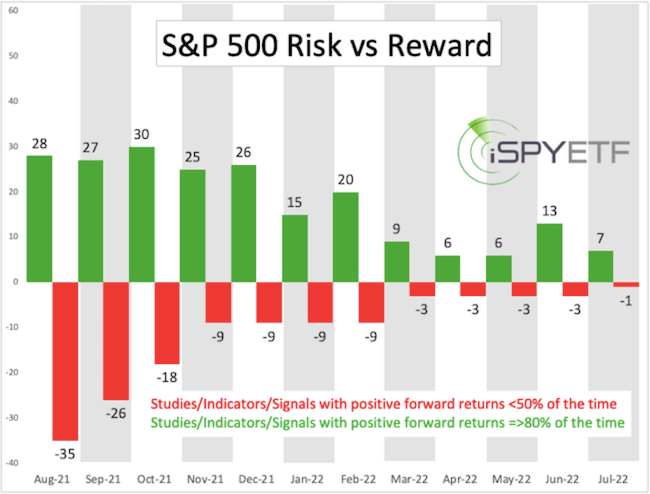
The Risk/Reward Heat Map (RRHM), featured in the September 6 Profit Radar Report (and re-posted below), showed an elevated risk level for September, and we saw the biggest pullback in over a year (5.28% peak to trough for the S&P 500).

Monday’s decline, the biggest one-day drop since May 12, moved a couple of big forecasting services to call this bull market ‘confirmed over.’

While the risk was ‘on schedule,’ I didn’t – I couldn’t – call the bull market over or even presume further losses. Here were my three reasons for giving bulls the benefit of the doubt:

– The S&P 500 still closed above key long-term support levels

– The decline unfolded in only 3 waves (wave 3 tagged Fibonacci target at 3,308).

– Stocks left a massive open chart gap

In Monday’s special Profit Radar Report update I stated the following:

The S&P 500 decline is best counted as 3 waves. There is a massive open chart gap at 4,427.78 which is highly likely to be closed. The S&P 500 closed above various support levels and is likely to bounce from here.”

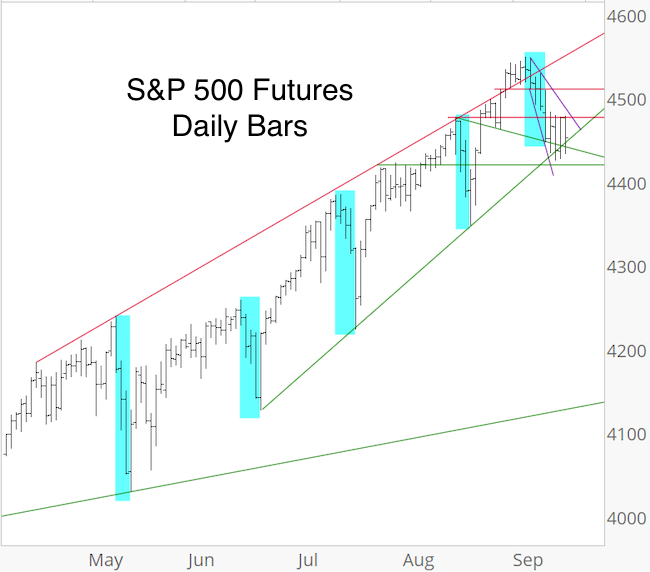
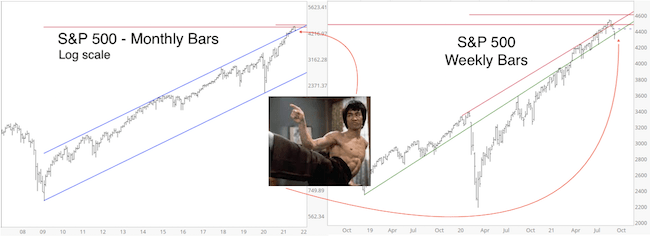
The charts below show two long-term S&P 500 support or ‘ditch levels’ (as in: don’t ditch stocks until support is broken).

The next chart shows the 3-wave decline (this is the original chart published in Monday’s Profit Radar Report) and open chart gap (dashed purple line). Also notice that wave 3 tagged the 1.618 Fibonacci extension level (of wave a green line) at 3,308 and that RSI-2 was over-sold.

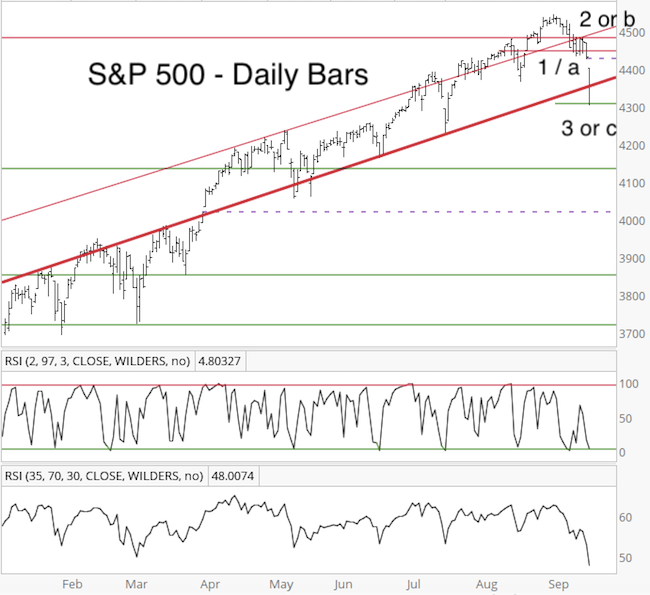
As of this morning, the gap has been closed and price already overlapped the wave a low (4,435.36), which means a straight-forward, bearish 5-wave decline is no longer possible.

According to Elliott Wave Theory, a 5-wave decline would have indicated a trend change from up to down, while a 3-wave decline is only a counter trend correction.

To be honest, on Monday I thought there’s at least a 50% chance the 3-wave decline in place at the time would tag on waves 4 and 5 and turn into a more bearish 5-wave decline.

A number of analysts projected just that and already called the bull market over, but such conviction without evidence is just wishful thinking. My analysis is certainly not perfect, but I don’t allow it to be clouded by personal expectations.

Based on Elliott Wave Theory, the decline is likely over unless it turns into a more rare and exotic pattern indicative of a trend change.

Simply based on resistance, stocks still could be rebuffed and I mentioned in Sunday’s Profit Radar Report that:

“Bearish September seasonality seems to have gotten a fair amount of media attention. The market may decide to bounce and flush out premature bears.” I suppose the bounce is accomplishing just that.

Continued updates, out-of-the box analysis and forward performance based on historic precedents are available via the Profit Radar Report.

S&P 500 Update


Subscribers to iSPYETF’s free e-mail newsletter receive a market outlook, usually once a week. The market outlook below was sent out on September 16. If you’d like to sign up for the free e-newsletter, you may do so here (we will never share your e-mail with anyone, just as we don’t accept advertising).

This is the S&P 500 Futures chart we’ve been looking at. The September 6, Profit Radar Report stated that: “Initial support is at 4,510 and a break below will increase short-term risk.”

The S&P has drifted lower since falling below 4,510 and, unlike all other pullbacks since April (blue boxes), the S&P has not bounced right back. Perhaps this means that the character of this rally has changed. Next support is in the low 4,400s. A sustained break below would further increase risk.

AAPL peeled away from double resistance, and the decline from last week’s high looks like 5 waves, which suggests 2 things:

1) a bounce (wave b or 2)

2) followed by a relapse and at least one more leg down (wave c or 3)

Last week’s Market Outlook mentioned that August highs tend to make investors cry (if you haven’t read it, the full article is available here). Here is another study that suggests to be cautious.

The chart below plots the S&P 500 (red graph, since 12/1/20) against the 10 most similar time periods. For this study we only focus on the average forward performance, which is illustrated by the bold black graph to the right of the dashed red line.

On average, the S&P has hit a rough spot right about now … and that rough spot can last several months.

The Risk/Reward Heat Map projected risk for September and we are starting to see some of that risk. To kick up the risk level further, the indexes need to stay below resistance for the next few days and start heading south again thereafter (which seems like a real possibility).

Continued updates, out-of-the box analysis and forward performance based on historic precedents are available via the Profit Radar Report

The Profit Radar Report comes with a 30-day money back guarantee, but fair warning: 90% of users stay on beyond 30 days.

Barron’s rates iSPYETF a “trader with a good track record,” and Investor’s Business Daily writes “Simon says and the market is playing along.”

S&P 500: August Highs Make Investors Cry


Subscribers to iSPYETF’s free e-mail newsletter receive a market outlook, usually once a week. The market outlook below was sent out on September 9. If you’d like to sign up for the free e-newsletter, you may do so here (we will never share your e-mail with anyone, just as we don’t accept advertising).

The S&P 500 finished August perched on an all-time high (ATH). In the past, August highs have often made investors cry.

Since 1970, the S&P carved out 12 other August ATHs (it set a 6-year high in 1979 and missed a new ATH by a few tics in 1984). All 14 signal dates (starting with the first day of September) are shown and highlighted below.

It’s tough to cram 50 years of history into one chart, but we can still see that August ATHs preceded some challenging times (i. e. 1972, 1987, 2000, 2014). Let’s drill a bit deeper.

The chart below shows the S&P 500 forward performance starting with the first day of September. The 5 instances since 2000 are shown in yellow, the 9 instances prior to 2000 are shown in gray. 2020 (in red) shattered all precedents with the exception of 1986.

As the performance tracker (bottom table) shows, returns for the next 1 – 3 months have been dismal.

The above study was just 1 of 3 studies published in Monday’s Profit Radar Report, which also featured the latest Risk/Reward Heat Map (a visual tool that shows risk based on 100s of studies).

Stocks have been immune to any kind of risk projection so we need price to verify risk with a drop below support.

Below are some basic levels to help judge risk and reward. The Nasdaq QQQ ETF is up against resistance. It will take a break above resistance to unlock higher prices (perhaps a blow off top).

DJIA is stuck in a potential wedge. A move above and back below upper wedge resistance would be a warning signal, as would be a good close below the lower wedge line.

Monday’s Profit Radar Report showed the below Bitcoin Futures chart and pointed out that price is against resistance while over-bought, which meant short-term risk was elevated. Within hours, Bitcoin dropped 10,000 points, nearly 20%. This general bias is likely positive as long black trend channel support holds.

Continued updates, out-of-the box analysis and forward performance based on historic precedents are available via the

Continued updates and factual out-of-the box analysis are available via the Profit Radar Report

The Profit Radar Report comes with a 30-day money back guarantee, but fair warning: 90% of users stay on beyond 30 days.

Barron’s rates iSPYETF a “trader with a good track record,” and Investor’s Business Daily writes “Simon says and the market is playing along.”