Subscribers to iSPYETF’s free e-mail newsletter receive a market outlook, usually once a week. The market outlook below was sent out on July 8, 2021. If you’d like to sign up for the free e-newsletter, you may do so here (we will never share your e-mail with anyone, just as we don’t accept advertising).
Here is the S&P’s ‘resume’ for the first half of 2021 (how time flies!):
– S&P closed 5 consecutive months at an all-time high
– S&P closed April, May, June at an all-time high
– S&P gained 14.4%
– S&P delivered one of the most persistent H1 rally ever
That’s obviously impressive, especially after what happened 2020. The question is this: Have stocks come too far or will momentum push them higher?
To get a clue, I’ve identified times when the S&P 500 met at least 1 of the 4 criteria mentioned above. The search resulted in 45 dates, 10 of them met multiple (1 of them all) of the 4 criteria.
S&P 500 performance following the signal dates has been downright mind-boggling with a directional consistency of up to 88%.
The full study along with S&P 500 forward returns for each instance (including the one that met all 4 criteria), average return, odds of positive performance, etc. is available in the July 5 Profit Radar Report.
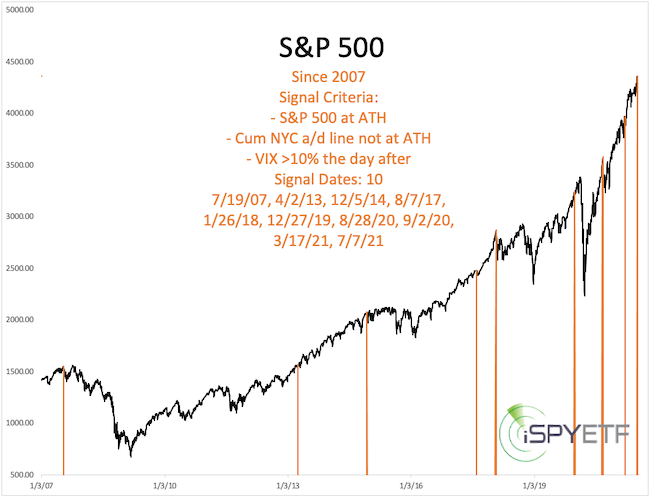
The VIX is up 13% today, which comes after a S&P 500 all-time high against a bearish NY Composite advance/decline line divergence yesterday.
This has happened only 9 other times since 2007. As the chart below shows, 5 of those 9 times preceded corrections (at times quite nasty ones). The other 4 times were quite bullish for stocks.

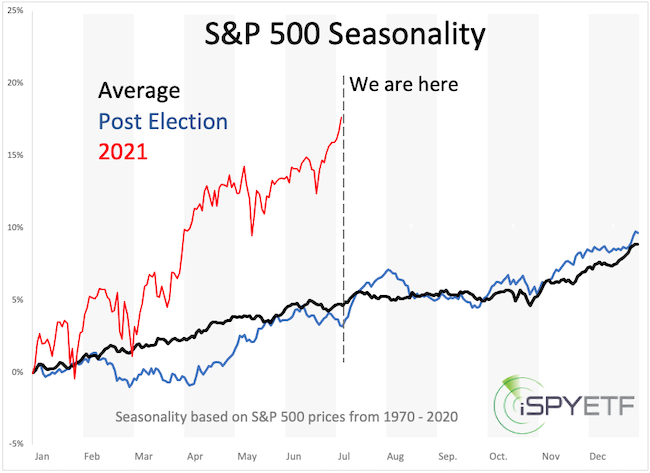
Courtesy of the pandemic, seasonality has become less effective, but it’s still one of the factors I monitor. The chart below compares YTD S&P 500 performance with regular and post election year seasonality.
July is a strong month in post election years … but then June was supposed to be flat … and was everything but.
More intriguing than S&P 500 seasonality is VIX seasonality right now. The June 13 Profit Radar Report stated that:
“The VIX is sliding lower with support at 13.50 – 15. VIX seasonality projects the biggest low of the year around late June.”
On July 28, the VIX traded as low as 14.10 and spiked as high as 21.29 since, a 51% move. That’s why I still look at seasonality.

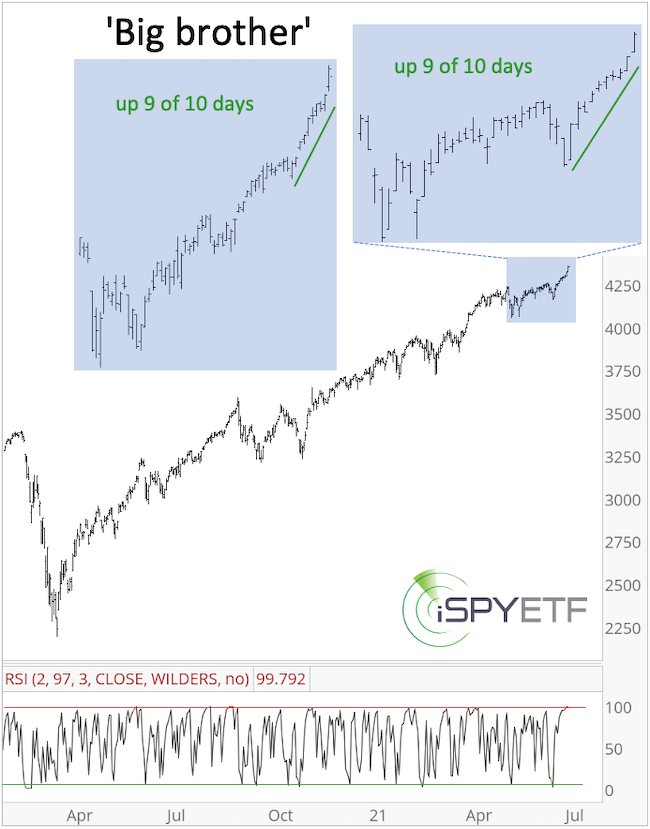
The July 5 Profit Radar Report highlighted that the S&P 500 had closed higher 9 of the last 10 session, a pretty rare feat.
Interestingly, this also happened not too long ago with a very similar looking pattern but on a larger scale. The blue chart insert below also shows the ‘big brother 9 of 10.’

Will the outcome be the same (the exact location of the ‘big brother 9 of 10’ was highlighted in the July 5 Profit Radar Report)?
There actually were more unique developments to share – such as extremely weak breadth as the S&P 500 is trading at all-time highs – but the bottom line is simple:
Long-term momentum is strong, but we are seeing some ‘smoke under the hood.’ Thus far the car (aka stocks) is still moving forward and we don’t want to throw ourselves in front of a moving car, but we’d also think twice about buying any such car.
Continued updates, out-of-the box analysis and forward performance based on historic precedents are available via the Profit Radar Report.
The Profit Radar Report comes with a 30-day money back guarantee, but fair warning: 90% of users stay on beyond 30 days.
Barron’s rates iSPYETF a “trader with a good track record,” and Investor’s Business Daily writes “Simon says and the market is playing along.”