Subscribers to iSPYETF’s free e-mail newsletter receive a market outlook, usually once a week. The market outlook below was sent out on May 2, 2024. If you’d like to sign up for the free e-newsletter, you may do so here (we will never share your e-mail with anyone, just as we don’t accept advertising).
Volatility is back … kind of. Last week, the Nasdaq-100 was up 4% after being down 5.36%. Over the past 6 years, the Nasdaq-100 has dropped and subsequently popped 4% or more 8 other times. The blue boxes below highlight those times (they weren’t a particularly good or bad omen).
Thus far, the scope of the recent correction is in line with my expectations expressed in the April 10 Profit Radar Report:
“The S&P 500 is on the verge of entering a correction. The ‘ideal scenario’ would be a choppy 5-10% correction.”
The April 14 Profit Radar Report expanded a bit further on what I’d like to see:
“Ideally we would like to see several more weeks of a choppy correction with ultimately lower down side targets. Hopefully we will get lower prices and some low-risk entries sometime in May.“
I’ll be the first to admit that the pattern of the decline from the high is messy, but that too is ‘normal’ considering that the S&P 500 may be in a larger scale wave 4 diagonal (waves 4 are usually choppy and hard to predict).
Because of the inherent uncertainty that’s to be expected in this situation, I’ve refrained from trying to forecast what will happen and instead outlined what ideally should happen.
If the S&P 500 follows the ideal projection reasonably well, confidence increases that we are on the right path. That path leads to an eventual buying opportunity.
At this point, the S&P 500 is still above the ideal down side target, but I will be starting to look for tell-tale signs of a potential low.
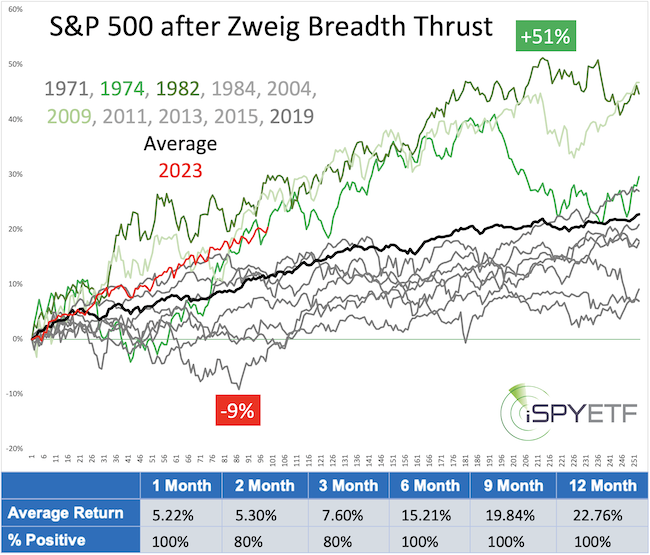
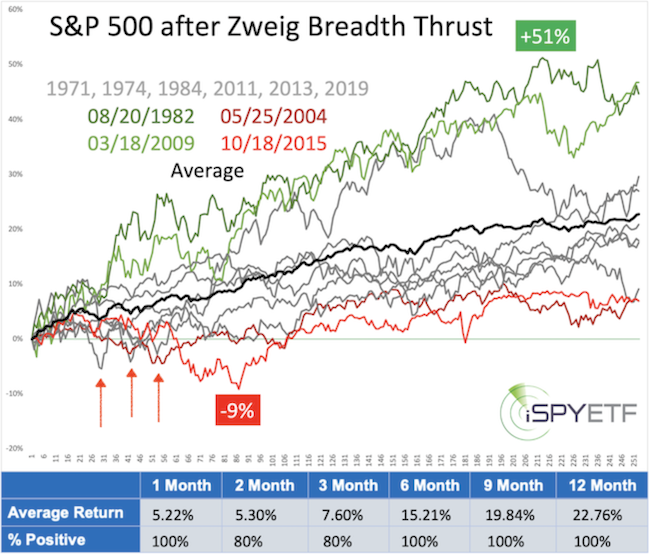
Back in November 2023, and many times since, I’ve pointed to the Zweig Breadth Thrust and its bullish implications. The chart below compares, once more, how the November 2023 buy signal (red graph) compares to others. Even the best historic signals (1974 & 1982 – graphs in green) took a breather after about 5 months.
And of course, it’s important to mention that two major US indexes show open chart gaps at higher prices. My subscribers know the value of chart gaps as they have told us for over a decade to continue expecting new all-time highs.
A word of caution: Stocks rallied stronger and longer than they ‘should have.’ Therefore it is possible the pendulum will swing to the other extreme. The market could deliver a wicked selloff to wash out the weak hands.
To sum up: The question is not if investors should buy, but when and where they should buy.
Subscribers to iSPYETF’s free e-mail newsletter receive a market outlook, usually once a week. The market outlook below was sent out on April 2, 2024. If you’d like to sign up for the free e-newsletter, you may do so here (we will never share your e-mail with anyone, just as we don’t accept advertising).
100-day Anniversary
The stock market rally from last year’s low just celebrated its 100-day anniversary. And what a 100+ days it’s been. The S&P 500 gained 27% during that time and delivered one of the most resilient up trends ever.
You probably remember that this rally started out with a Zweig Breadth Thrust (ZBT). I wrote about it here (Triggered! The Gold Standard of Signals) and published the study below in the November 8, 2023 Profit Radar Report.
The image shows the S&P 500 performance after each prior ZBT signal. The various graphs show the post signal trajectories and the performance tracker (blue table) shows the actual S&P 500 returns and percentage of positive reactions.
Even a brief glance at the graphs and performance tracker explain why I called the ZBT the ‘gold standard of signals.’ The chart is updated to show the following:
1) S&P 500 return after the 11/3/2023 signal (red graph)
2) The best prior post-signal returns (various shades of green)
A comparison of the red and green graphs reveals that the performance following the November 3, 2023 signal rivals the best ZBT returns over the last 50 years.
I try to keep those newsletters short, and without too much bragging about prior calls, but if you’d like to know what the Profit Radar Report stated back in November of last year – when this rally was still in its infancy – you will find a section with two fascinating excerpts at the bottom of this newsletter.
The key question after a historically strong rally is this: Do melt-ups lead to melt-downs?
To get the best possible answer, we will:
– Identify similar S&P 500 rallies in the past based on 3 criteria
– Show how the S&P 500 reacted to similar conditions
– Project past performance into the future (like the performance tracker above
Yes, we all know the worn disclaimer that past performance is no guarantee of future performance. And it’s true, but how the stock market reacted to a very specific set of conditions in the past – especially when past reactions are consistent – often projects a rough future path (see the above ZBT projection, published 5 months ago).
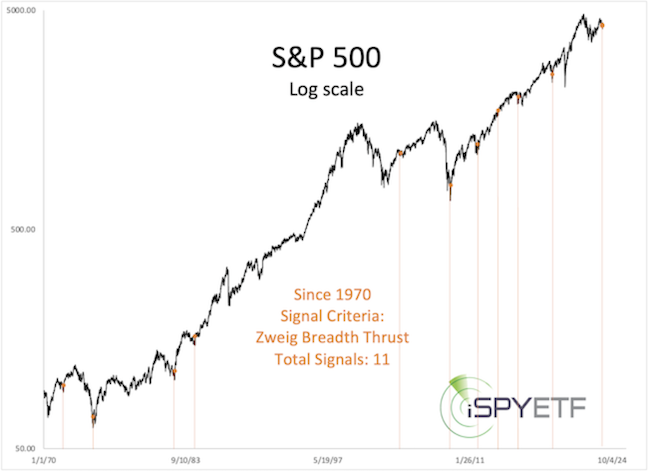
Identify criteria: Since the October, 2023 low, the S&P 500 has accomplished 3 rare feats:
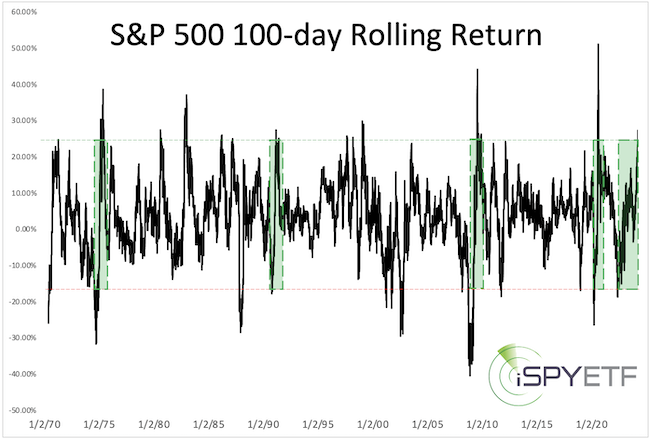
1) The S&P 500 gained 27% in 100 days. In fact, the rolling 100-day return jumped from -18.6% to 27.3%. This has happened only 4 other times (since 1970, see first chart below).
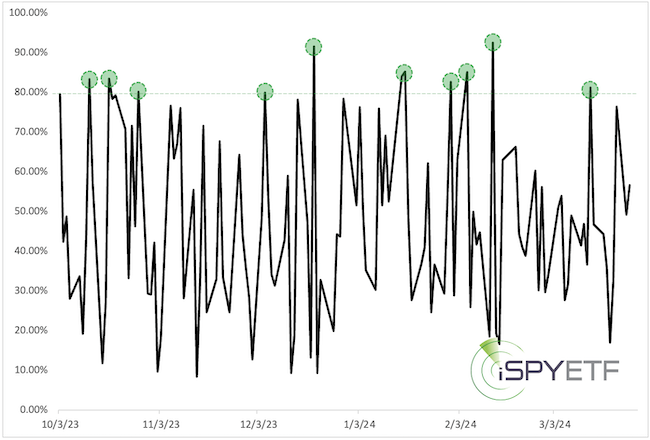
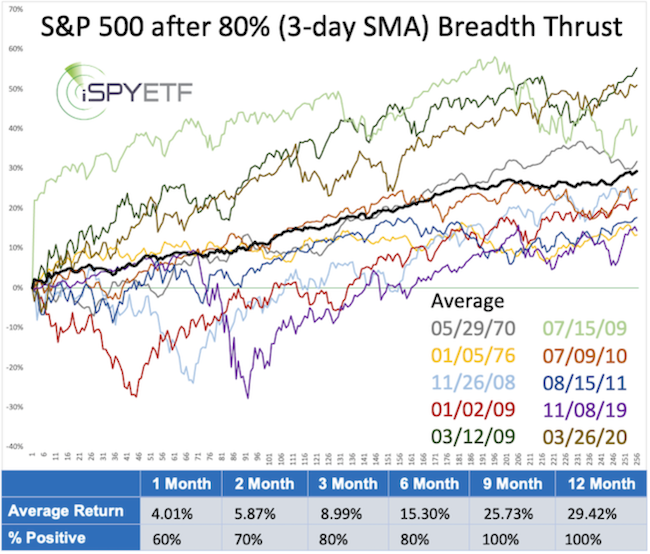
2) The first 100 days of that rally included 11 days with up volume of 80% or more (since 1970, see second chart below)
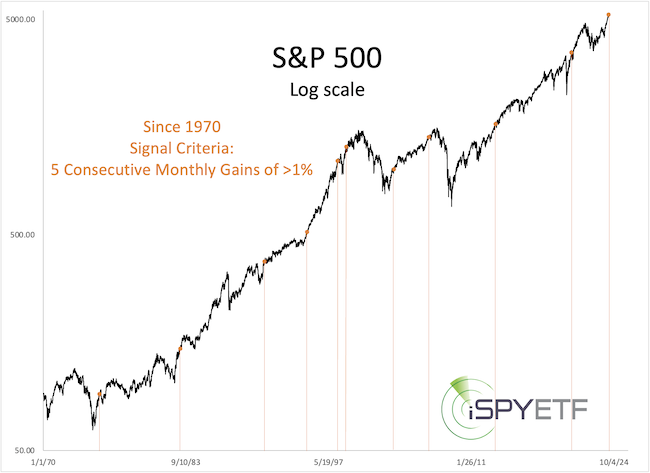
3) The S&P 500 ended March with a 3.1% gain, the fifth consecutive month with a gain of 1% or more. This happened only 10 other times since 1970.
We now use the above 3 rare feats as criteria (with some adjustments to the 100-day return study to increase the sample size).
In order to make the study more robust while keeping the results diversified, I combined criteria #1 & #2 into one study and criteria #3 into a separate study.
The criteria #1 + #2 study returned 12 signal dates, the criteria #3 study returned 11 signal dates. Keep in mind that’s for a lookback period of 54 years (going back to 1970). Anything around 10 is the perfect signal size, not too small, not too big.
Shown below are the 11 signal dates for the criteria #3 study. It’s tough to squeeze 54 years of history into one chart, but the signal dates already provide a rough idea.
The study gets even more telling when looking at the performance tracker (which includes average returns and odds for positive returns for the next 1, 2, 3, 6, 9, 12 months).
The performance tracker for both studies, but especially for the criteria #1 + #2 study, are powerfully consistent and a must know for everyone invested in stocks.
The complete analysis with performance tracker for both studies is available via the March edition of the Profit Radar Report.
The Profit Radar Report comes with a 30-day money back guarantee, but fair warning: 90% of users stay on beyond 30 days.
Barron’s rates iSPYETF a “trader with a good track record,” and Investor’s Business Daily writes “Simon says and the market is playing along.”
Excerpt from the November 19, 2023, Profit Radar Report:
Trust is a precious commodity, it is earned and not just extended equally to everyone … at least that’s the case in my personal and financial analysis life.
I always try to look at the complete picture and build a body of evidence. Every indicator is included in the Risk/Reward Heat Map as either bullish or bearish factor for a specific time period. But not every indicator receives the same amount of trust or consideration.
Elliott Wave Theory (EWT), for example, has not earned or received a lot of our trust lately, and rightfully so (some EWT analysts are backpedaling now and finding bullish interpretations where there were none a few weeks ago).
One of the most trusted (although least know) ‘indicators’ have been chart gaps. And once again it appears like our trust in chart gaps getting filled was well-placed. At this point, the open S&P 500 chart gap is only 53.51 points away. I won’t take much to remove this indicator and the implied ‘up side guarantee.’ If the gap gets closed, we hope a new one will open if and before the market decides to decline.
Based on the historic track record, the Zweig Breadth Thrust (ZBT) – discussed in the November 8 and 11 PRRs – deserves a fair amount of trust as well. In terms of up side target, the ZBT is not nearly as specific as open chart gaps, but it tells us that the odds strongly favor rising stocks. Based on the post-ZBT price trajectory, this overall bullish outlook deserves our trust as long as the S&P 500 does not close below 4,100.
Excerpt from the November 11, 2023, Profit Radar Report:
As outlined in the July 23, PRR, we anticipated a summer correction. We didn’t know how deep the correction would be, but we knew that price would eventually come back and close the open chart gaps. For example, the August 6, August 27, September 24 PRRs all made comments similar to this one (from August 6):
“The most important thing to watch, at this point, is the open S&P 500 chart gap at 4,567.53. As long as it remains open (and we hope it does), we are very confident that any losses (and we hope we’ll see more) will be retraced and there will be an eventual buying opportunity.”
Rather than being side-tracked by many cross currents, now may be the time to keep it simple and focus on this:
– We got the summer correction we expected.
– We got a breadth thrust that sets up our expectation of “any losses to be retraced.”
– We got what we hoped for. Next up should be a rally to close the gap at 4,567.53.
As detailed in Wednesday’s (November 8) PRR, the S&P 500 has not lost more than 5% following a Zweig Breadth Thrust within the first few months of the signal (November 3). Deducting 5% from the November 3, S&P close at 4,358.34 brings us to 4,140.42, which is close to the October low at 4,103.78. For simplicity, we will assume that the trend is up as long as the S&P 500 does not close below 4,100.
Subscribers to iSPYETF’s free e-mail newsletter receive a market outlook, usually once a week. The market outlook below was sent out on March 14, 2024. If you’d like to sign up for the free e-newsletter, you may do so here (we will never share your e-mail with anyone, just as we don’t accept advertising).
First mover advantage is a competitive advantage gained from being the first to introduce and distribute a product. Famous examples are said to include Coca Cola, Kellogg’s, Apple, Google.
There is also a ‘first mover’ advantage when it comes to stock market indicators. Those who first recognize the validity of an emerging indicator benefit before, and until, the crowd catches on. By the time an indicator becomes widely-known, it usually has lost some or much of its accuracy.
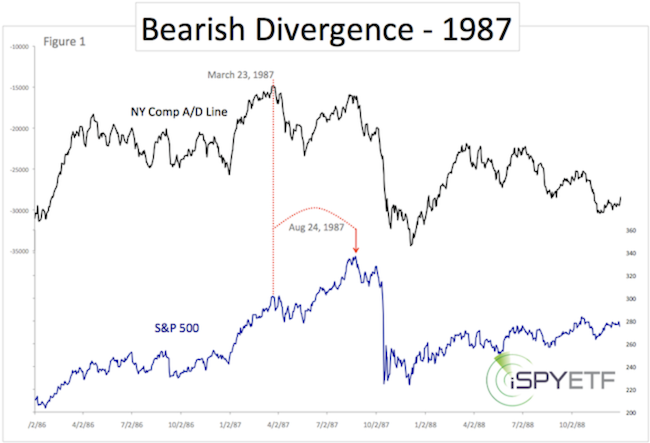
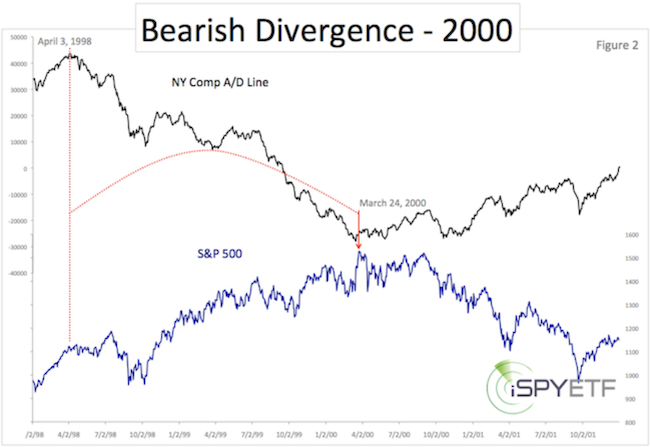
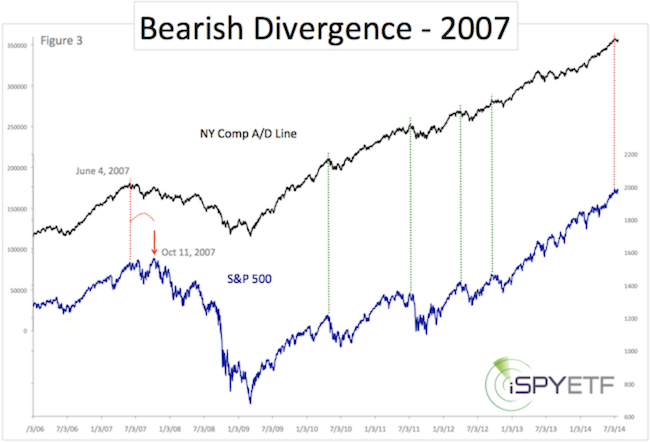
One of those indicators is the cumulative NY Composite advance/decline line (NYC a/d line). The NYC a/d line is basically a running total of daily net advancing stocks.
A bearish divergence between the S&P 500 and the NYC a/d line correctly foreshadowed the 1987, 2000 and 2007 market crashes.
The 3 charts below outline the divergences that developed in 1987, 2000 and 2007. The charts and analysis were published in my July 24, 2014 Special Report entitled: How to Discern A Major Market Top (available to subscribers of the Profit Radar Report).
At the time – over a decade ago – the Profit Radar Report was one of the only newsletters to focus on the NYC a/d line. Using that indicator served subscribers well. Ever since the 2009 bear market low, we’ve used the NYC a/d line to evaluate if a major market top was forming.
Based on my interpretation of the data, The Profit Radar Report has not called for a major market top at any point over the past 10+ years (can you think of any other market forecasting service who hasn’t called for a major market top in over a decade?).
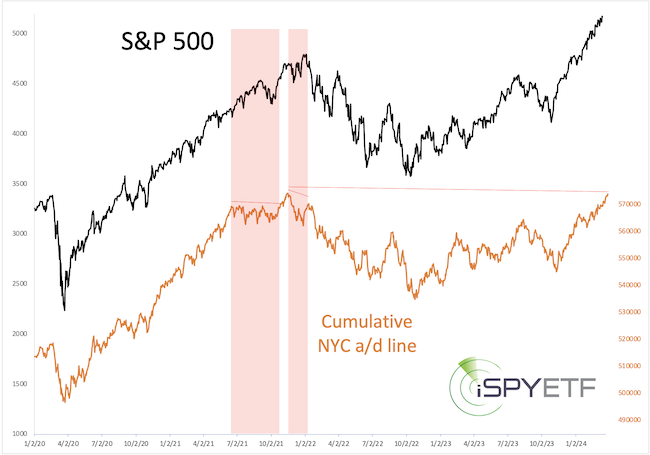
Starting a few years ago, the NYC a/d line morphed from a little known indicator to a popular discussion topic. By now, you’ve probably seen or heard that the NYC a/d line has carved out one of the biggest divergence ever, dating back to the November 8, 2021 all-time high (see chart below).
In fact, for the past 2+ years, many analysts have been pounding the table, predicting a 1987/2000/2007-like crash because of that divergence.
Not the Profit Radar Report. We milked the first mover advantage while it was there but were smart enough not to jump on the ‘bearish divergence will lead to crash’ bandwagon.
Below are a few excerpts of how the Profit Radar Report disarmed the bearish NYC a/d line divergence:
The 2023 S&P 500 Forecast didn’t dwell on the bearish divergence, but highlighted that: “We will now look for signs of strength (a bullish divergence) that may suggest a bear market low is in place and/or if new all-time highs could be on the horizon.”
The 2024 S&P 500 Forecast also discounted the meaning of the bearish divergence and stated: “Although the cumulative NYC a/d lines are lagging, a renewed bearish divergence won’t occur until the S&P 500 reaches a new all-time high. Such a divergence, if and when it occurs, is certainly not a positive, but based on the weight of evidence, it may also not be a big negative force this time around. Perhaps, in time, an upcoming bearish divergence will even be erased.”
Fast forward to today; The bearish NYC a/d line divergence is almost erased. It will only take 197 more stocks advancing than declining and the bearish divergence will have been erased (as of yesterday’s close). No doubt many analysts will tout this new high – whenever it occurs – as an ‘all clear’ signal.
And while erasing that long-time bearish divergence would be a positive for stocks, it doesn’t mean stocks can’t correct and shake out the weak hands.
The NYC a/d line used to be my go-to indicators, now it’s just one of many. In fact, the weight of evidence (focusing on other time-tested indicators not yet discovered by the crowd) is what led me to believe that the bearish divergence will be erased without any damage being done first (see 2024 S&P 500 Forecast).
Momentum Markets
Momentum markets – like the one we’re in right now – are a special breed and frustrate many investors. This article (based on a recent Profit Radar Report update) highlights how other momentum markets played out and what we learned from them.
What about the Yellow Flags?
The last Free Market Outlook (from February 22) mentioned yellow flags (mainly lagging breadth). Are they still a concern?
Market breadth has improved and has been down graded as concern. It is now important to view price action in context of a momentum market.
The best way to navigate a momentum market is to allow price to grind higher as long as support holds (this was also mentioned in the February 22, Free Market Outlook).
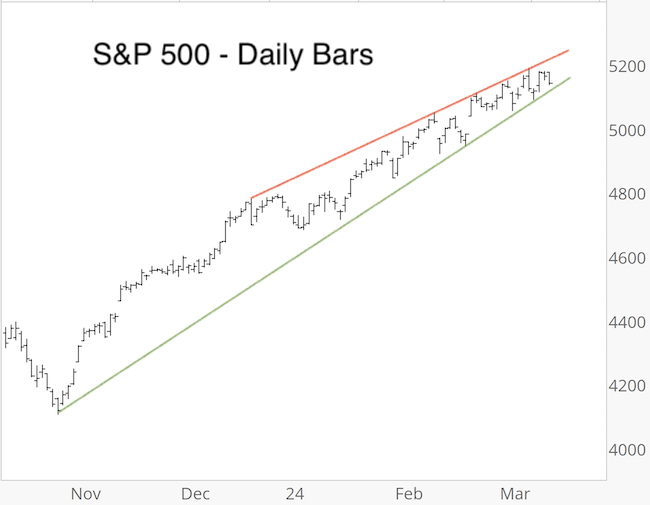
The chart below shows the S&P 500 since the October low.
Wedges like the one outlined by the red and green line can fall apart quickly. The first step – and next yellow flag – will be a close below the green line. This wouldn’t be an automatic sell signal, but could be the first tell-tale sign of a deeper pullback.
Continued updates based on purely fact-based analysis is available via the Profit Radar Report.
The Profit Radar Report comes with a 30-day money back guarantee, but fair warning: 90% of users stay on beyond 30 days.
Barron’s rates iSPYETF a “trader with a good track record,” and Investor’s Business Daily writes “Simon says and the market is playing along.”
Subscribers to iSPYETF’s free e-mail newsletter receive a market outlook, usually once a week. The market outlook below was sent out on February 22, 2024. If you’d like to sign up for the free e-newsletter, you may do so here (we will never share your e-mail with anyone, just as we don’t accept advertising).
The S&P 500 is about to record the 12th all-time high in 2024, one of the best starts to a year ever.
This is a good time for a reality check. Many of the folks cheering higher prices now, were calling for a crash just a few months ago.
You may remember headlines like the following, most of them published around October, 2023, when the S&P was trading in the low 4,000s:
– Stock Market Crash Ahead – Forbes
– Huge Market Crash Coming – Markets Insider
– Top Strategist sees Echoes of 1987 Crash in Today’s Stock Market – Fortune
– S&P 500 Could Crash 27% as US tips into Recession – Business Insider
– Magnificent Seven Stocks Starting to Resemble ‘Nifty 50’ that got Crushed in 1970s Market Crash – MarketWatch
– Expert Says S&P 500 Ripe for Steep Drop up to 63% – Business Insider
– Legendary Investor Jeremy Grantham Says Stock Market has a 70% Chance of Crashing – Fortune
– This Fund Manager is Holding 60% Cash – and Expecting a Stock Market Crash – MarketWatch
– US Economist Predicts 2024 Will Bring Biggest Crash of Our Lifetime – Fox Business
– Shocking Parallels Between S&P 500 and 1929 Stock Market Crash – Finbold
– How Likely is a 1987-Style Stock-Market Crash Today? Likelier than You’d Think – MarketWatch
Hard to believe that many of those headlines are less than 5 months old.
In contrast to those headlines, you can read any of my Free Market Outlook Updates published over the past 6 months (or 18 months) – and available for review on iSPYETF.com – and you will find the same underlying message in each one of them: Stocks will rally strongly once the correction is complete.
The pendulum has now swung from bearish to bullish sentiment, and some pundits claim there’s now too much bullishness for stocks to continue higher. Commonly quoted sources of excessive bullishness are the Investors Intelligence survey of newsletter writers and other weekly polls.
That too much bullishness is bad for stocks sounds right from a contrarian point of view, but I wanted to see what the actual data says.
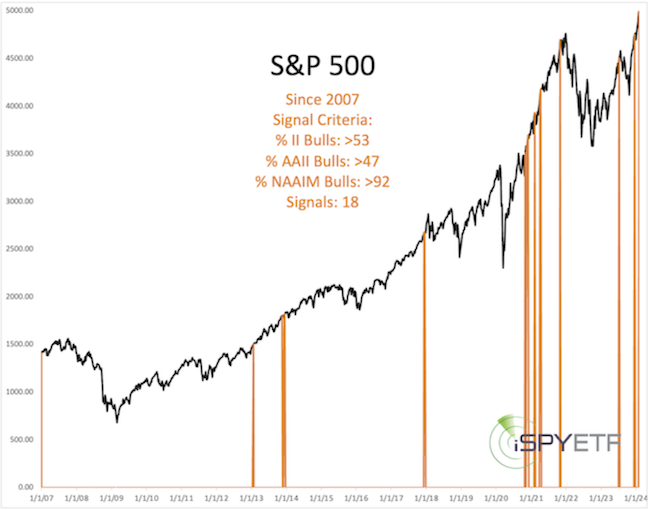
The chart below, published in the February 11, 2024 Profit Radar Report, highlights every time when the percentage of bullish investors (polled by II, AAII, NAAIM) was similar or greater than right now.
There were 17 other signals (since 2007). Do you see strong evidence that stocks are doomed to decline based on investor sentiment? I don’t, at least not based on sentiment.
Short-term Outlook
Although investor sentiment is not a valid concern, market breadth started to deteriorate in February, raising some yellow flags.
Here is how yellow flags should be viewed (February 7, 2024 Profit Radar Report):
“We are seeing some conditions that come with increased odds of a pullback. But conditions are not signals, so we’ll allow those conditions to go on (and price to go up) until they matter. For the S&P 500, price can continue to at least 5,020 as long is it stays above 4,910.”
In other words, a yellow flag is not an automatic sell signal. It’s best to allow the conditions that cause a yellow flag to continue as long as price stays above technical support, in this case 4,910.
The S&P fell as low as 4,920, but stayed above 4,910, which keeps the up trend in tact.
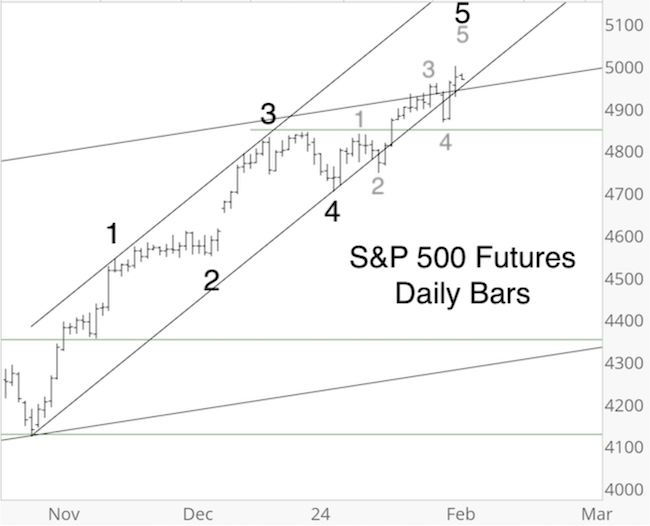
In terms of Elliott Wave structure, this is what I published as most likely path in the January 10, 2024 Profit Radar Report.
The path continues to play out reasonably well and there is no need to adjust. This structure, if indeed in play, is nearing maturity and S&P 500 Fibonacci resistance around 5,115 is worth watching as potential inflection zone.
How this 5-wave structure fits into the larger picture is discussed in the 2024 S&P 500 Forecast.
To access the 2024 S&P 500 Forecast and purely fact-based analysis, test drive the Profit Radar Report now and become the best-informed investor you know.
The Profit Radar Report comes with a 30-day money back guarantee, but fair warning: 90% of users stay on beyond 30 days.
Barron’s rates iSPYETF a “trader with a good track record,” and Investor’s Business Daily writes “Simon says and the market is playing along.”
Subscribers to iSPYETF’s free e-mail newsletter receive a market outlook, usually once a week. The market outlook below was sent out on January 25, 2024. If you’d like to sign up for the free e-newsletter, you may do so here (we will never share your e-mail with anyone, just as we don’t accept advertising).
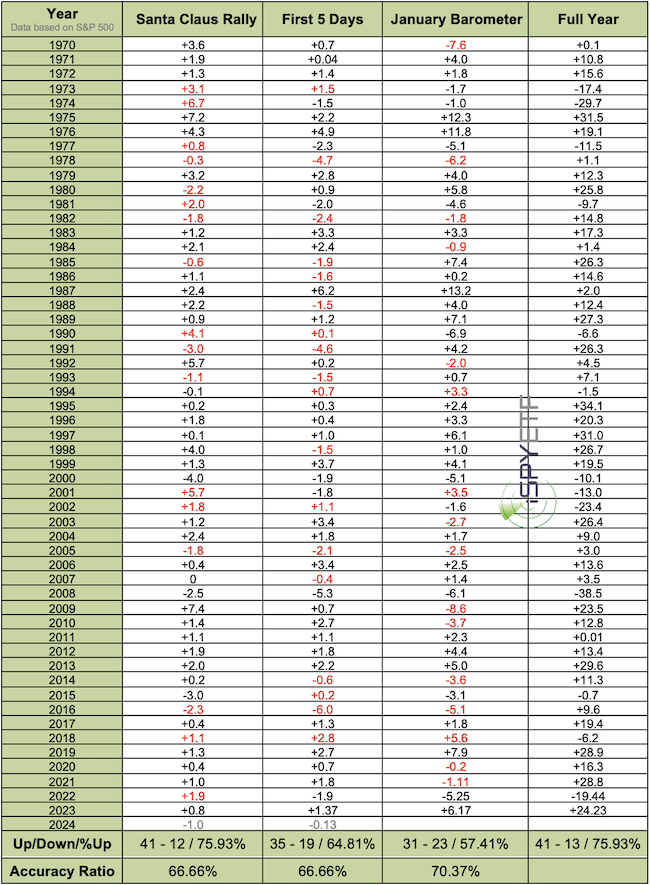
January is an interesting month because it can set the tone for the rest of the year. That’s where the term January Barometer (as January goes, so goes the year) comes from. Statistically (going back to 1970), the January Barometer is accurate 70.37% of the time (but, as discussed below, it can be as accurate as 95%).
Another popular barometer is the so-called Santa Claus Rally; “if Santa fails to call, bears may come to Broad and Wall.” You’ve heard it. As a barometer, the Santa Claus Rally is accurate 66.66% of the time.
And, there’s one more. The First 5 Days of January. As a barometer, the first 5 days of January are accurate 66.66% of the time.
The individual accuracy ratings have no wow factor, but they can be quite helpful when combined.
For example, last year (2022/2023), all three barometers were positive. That constellation happened 20 times before, 19 times the S&P 500 ended the year with a gain.
That’s why the 2023 S&P 500 Forecast (available to subscribers of the Profit Radar Report) stated that: “Based on these barometers, there’s a 95% chance the S&P will end 2023 with a + before the final return figure.”
This year, the Santa Claus Rally failed to materialize, which sparked a number of bearish media headlines. The first 5 days of January were down too. Should you worry?
The 2024 S&P 500 Forecast pointed out that: “This happened 9 other times. Of those 9 times, the January Barometer joined with a negative reading 6 times. Of those 6 times, the S&P 500 ended the year with losses only twice. The 3 times the January Barometer did not join the negative Santa Claus Rally and First 5 Days of January, the S&P 500 ended the year with gains.”
It looks like the January Barometer for 2024 will end up positive, which increases the odds of a positive year for stocks. The odds are not 95% like last year, but still favorable.
The table below shows the 3 barometers along with the full year returns. Returns in red mean that the barometer failed as an indicator for that year.
The barometers are just one of many time-tested indicators covered by the Profit Radar Report’s 2024 S&P 500 Forecast. Others include market breadth, technical analysis, Elliott Wave Theory, investor sentiment, seasonality, valuations, money flow, and the fallacy of following the financial media.
Short-term Outlook
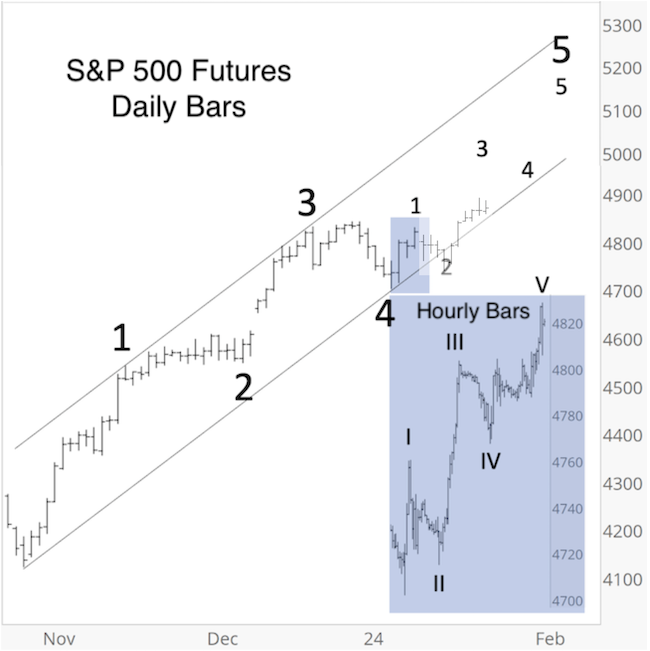
Believe it or not, the first few trading days of 2024 actually delivered a discernible Elliott Wave structure for S&P 500 Futures. I published that structure in the January 10, Profit Radar Report (see below).
Thus far, price has followed the projection (and channel) very well, but there is resistance.
Chart Resistance
Based on the above Elliott Wave pattern, the S&P 500 should move higher, but will have to overcome trend channel and Fibonacci resistance around 4,890 first. While below resistance, there is a measure of risk.
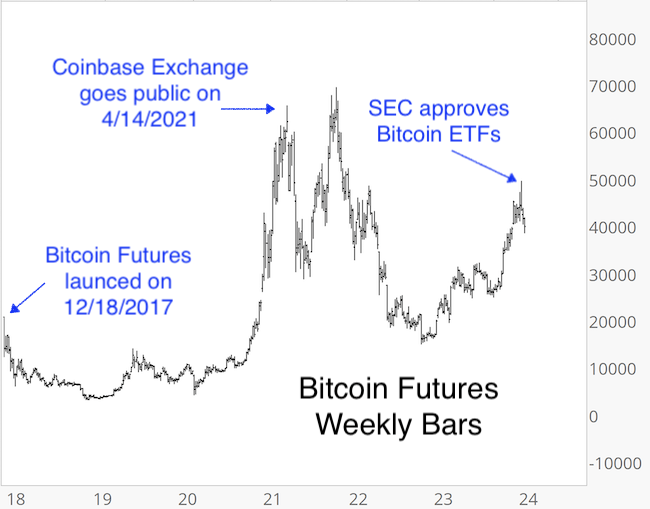
Bitcoin’s ‘Watershed Moment’
Last week, the SEC approved the first U.S.-listed ETFs to track bitcoin, in what Reuters called a “watershed for the crypto market.”
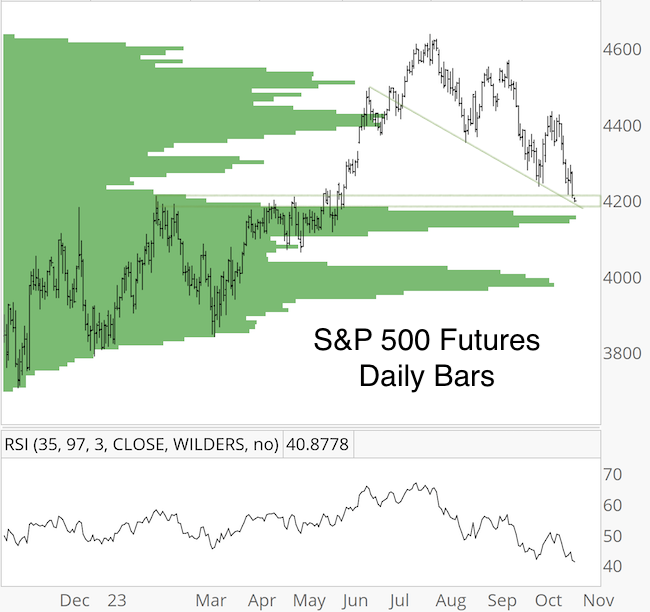
The same day, via the January 10, Profit Radar Report, I published this chart and warning:
”The crypto market had a few watershed events before, but none of them turned out that well for digital currencies or bitcoin. Bitcoin futures are at resistance, RSI-35 is lagging. At least a short-term pullback would make sense here.”
Since its ‘watershed high,’ bitcoin futures lost as much as 15%. Price is now approaching support, but is also below resistance around 41,000.
As you may have noticed, the Profit Radar Report takes a composite, common sense, data-based approach to investing.
The best way to evaluate the Profit Radar Report is to sign up for a test drive and read the 2024 S&P 500 Forecast.
Before you do that, feel free to read the 2023 S&P 500 Forecast here and compare the forecast with what actually happened. I think you’ll be impressed.
Test drive the Profit Radar Report now and become the best-informed investor you know.
The Profit Radar Report comes with a 30-day money back guarantee, but fair warning: 90% of users stay on beyond 30 days.
Barron’s rates iSPYETF a “trader with a good track record,” and Investor’s Business Daily writes “Simon says and the market is playing along.”
Subscribers to iSPYETF’s free e-mail newsletter receive a market outlook, usually once a week. The market outlook below was sent out on January 4, 2024. If you’d like to sign up for the free e-newsletter, you may do so here (we will never share your e-mail with anyone, just as we don’t accept advertising).
Today’s free Market Outlook contains some charts and forecasts previously only shared with subscribers. Hope you will find them helpful in navigating 2024.
As regular readers know, the Profit Radar Report always provides objective and comprehensive analysis and sums up all that information with a simple, bottom line summary.
The bottom line for much of H2 2023 was this observation, first published in the August 6 Profit Radar Report (and many times thereafter):
“The most important thing to watch, at this point, is the open S&P 500 chart gap at 4,567.53. As long as it remains open (and we hope it does), we are very confident that any losses (and we hope we’ll see more) will be retraced and there will be an eventual buying opportunity.”
As the chart below shows (you may remember it from the last free Market Outlook), the S&P 500 rallied impressively (and unexpectedly for most) to fill the charts.
Closing the gaps eliminated the ‘up side guarantee.’ Now what?
Here is what the November 19, 2023 Profit Radar Report stated:
“One of the most trusted (although least know) ‘indicators’ have been chart gaps. And once again it appears like our trust in chart gaps getting filled was well-placed. At this point, the open S&P 500 chart gap is only 53.51 points away. I won’t take much to remove this indicator and the implied ‘up side guarantee.’ If the gap gets closed, we hope a new one will open if and before the market decides to decline.
Based on the historic track record, the Zweig Breadth Thrust (ZBT) – discussed in the November 8 and 11 PRRs – deserves a fair amount of trust as well. In terms of up side target, the ZBT is not nearly as specific as open chart gaps, but it tells us that the odds strongly favor rising stocks. Based on the post-ZBT price trajectory, this overall bullish outlook deserves our trust as long as the S&P 500 does not close below 4,100.”
Why does the Zweig Breadth Thrust deserve our trust?
The November 8, 2023 Profit Radar Report explained:
“I read the following today: ‘The Dow and S&P indexes closed higher both Monday and Tuesday attended by negative breadth, usually a strong sign that an advance is terminal.’ This haphazard blanket statement is void of facts, like concluding someone has cancer because they are in pain. Not surprising this is coming from a permabear outfit that’s ignoring last week’s strong breadth performance.
In fact, last week’s surge triggered a Zweig Breadth Thrust (ZBT) for the fist time since 2019. There are different kind of ‘thrusts,’ but the ZBT is rules-based and therefore well respected. Since 1970, the ZBT (first time in a year) triggered only 10 other times.
The chart below highlights those 10 other times.
The next chart shows the S&P 500 forward performance following the last 10 signals. As far as signal consistency is concerned, that’s about as good as it gets. Shown in green are the two most bullish signals, in red are the two most bearish signals. The remaining signals are in gray. Not all of the signals delivered blockbuster returns, but all of them showed gains after 6, 9, 12 months.
What about this week’s soft breadth numbers? Statistically, stocks are prone to take a breather immediately following a breadth thrust, so a pullback is in line with historic performance. As the above chart shows, the worst reactions following a signal showed 5%, 4%, 4% losses within the first 3 months (and 9% 4 months later). A drop below 4,140 (5% loss from Friday’s close) within the next few months would be a departure from previous post signal trajectories and perhaps an early indication that the ZBT may not work as usual.”
The Profit Radar Report’s Risk/Reward Heat Map (RRHM) is fed by the projected forward returns of dozen’s of studies like the one above. The RRHM weight of evidence forecast harmonized with the Zweig Breadth Thrust study, which is why the November 19, 2023 PRR outlined this simple, bottom line approach going forward:
“The odds strongly favor rising stocks. Based on the post-ZBT price trajectory, this overall bullish outlook deserves our trust as long as the S&P 500 does not close below 4,100.”
The positive breadth thrust implication are reduced (likely short-term) by extreme investor sentiment readings. Therefore the sluggish start into 2024 is no surprise. It’s actually healthy and I would be thrilled to see further losses. Why? Because new chart gaps have opened up, virtually guaranteeing a recovery.
At no point did the S&P even get close to 4,100 and rallied stronger than even I – one of the last remaining bulls – anticipated.
The full 2024 S&P 500 Forecast will be published soon. Before you take the plunge and subscribe to the Profit Radar Report, take a look at last year’s 2023 S&P 500 Forecast (now available for the first time for free) and compare how it compares to reality. I think you’ll be impressed.
Once you see for yourself, feel free to take the Profit Radar Report for a test drive and become the best informed investor you know.
The Profit Radar Report comes with a 30-day money back guarantee, but fair warning: 90% of users stay on beyond 30 days.
Barron’s rates iSPYETF a “trader with a good track record,” and Investor’s Business Daily writes “Simon says and the market is playing along.”
Subscribers to iSPYETF’s free e-mail newsletter receive a market outlook, usually once a week. The market outlook below was sent out on November 30, 2023. If you’d like to sign up for the free e-newsletter, you may do so here (we will never share your e-mail with anyone, just as we don’t accept advertising).
This is by far the most reliable chart pattern I’ve ever encountered. It is still widely unknown and highly effective. In fact, it struck again last week and confirmed its 100% track record of accuracy.
I’ve covered the pattnern in these pages many times in the past and called it ‘rally guarantee’ in the June 1, 2023 free Market Outlook.
The last time this chart pattern unfolded, I only wrote about it in the Profit Radar Report (my apologies to the readers of the free Market Outlook). It actually happened twice in H2 2023: On August 2, and September 21. What is this so reliable pattern? Chart gaps.
Why do the matter? Because all down side chart gaps over the past 15+ years have been filled.
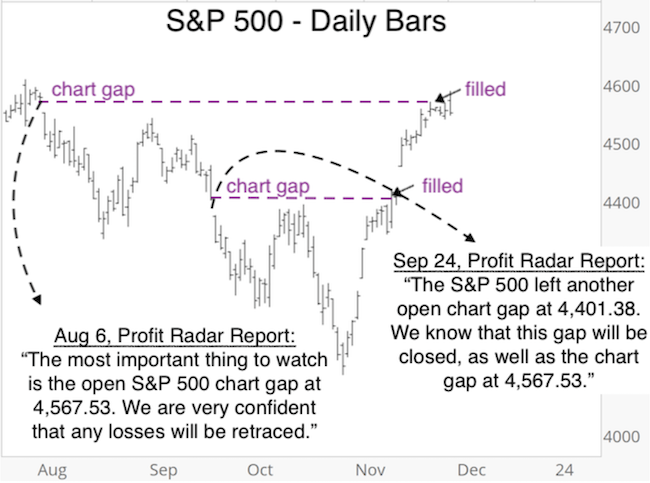
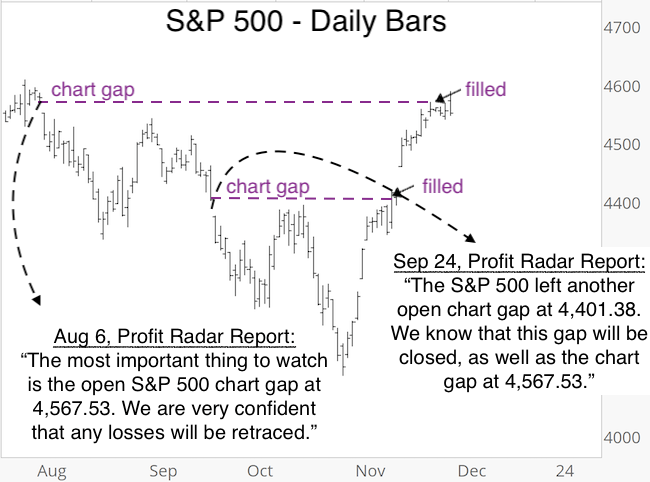
The purple lines highlight the August 2 and September 21 chart gaps.
Below are the corresponding comments in the subsequent Profit Radar Report updates:
August 6, Profit Radar Report: “The most important thing to watch, at this point, is the open S&P 500 chart gap at 4,567.53. As long as it remains open (and we hope it does), we are very confident that any losses (and we hope we’ll see more) will be retraced and there will be an eventual buying opportunity.”
September 24, PRR: “S&P 500 also left another open chart gap at 4,401.38. We know (with as much certainty as possible when it comes to market analysis) that this gap at 4,401.38 will be closed, as well as the chart gap at 4,567.53.”
As the chart above shows, the September 21 gap at 4,401.38 was closed on November 10. The August 2 gap at 4,567.53 was closed on November 22.
Elliott Wave Theory update
It’s time to update the Elliott Wave Theory (EWT) scenario first discussed in the July 23, Profit Radar Report (also covered in the free Market Outlook here and here):
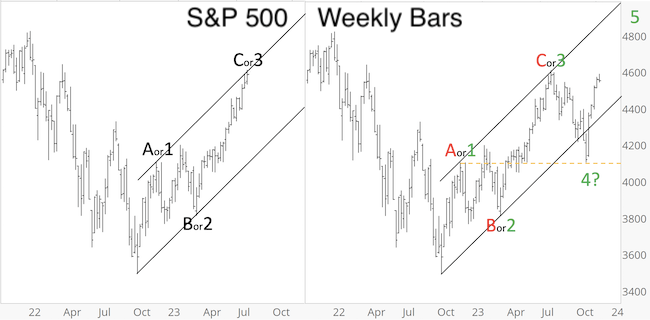
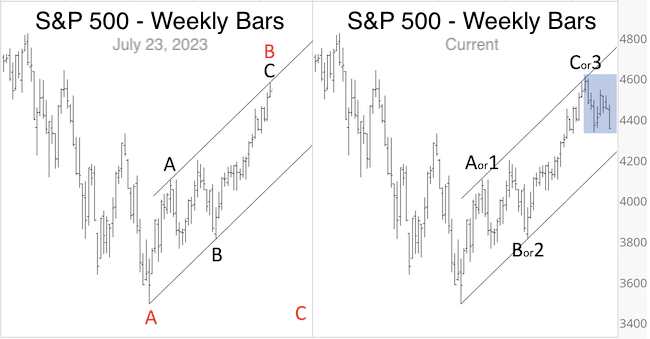
The July 23, Profit Radar Report warned that: “The Elliott Wave Theory (EWT) structure is at a point where a pullback is becoming more likely. Shown in the chart below is the most bearish version, but the advance could also be 1, 2, 3 instead of A, B, C. An upcoming decline could be a more shallow wave 4 or severe wave C (red). Based on the Risk/Reward Heat Map, the bearish version is very unlikely, but not impossible.“
Shown below is the original July 23 chart (left) and updated chart (right).
As anticipated, the S&P 500 pulled back after touching the trend channel at the wave C or 3 location.
One of the cardinal EWT rules is that waves 1 and 4 are not allowed to overlap (click here for more details on EWT). The overlap level is indicated by the dashed orange line. This bearish overlap was only narrowly avoided.
While the pullback warning near the July high was fairly straight-forward, the pattern since then is not. Technically the S&P could still rally to carve out wave 5. Since the overlap was avoided by only 2.28 points (0.07%) and because other indexes sport entirely different patterns, I recommend against hitching ones invest decisions to EWT. Don’t get me wrong, I’m not saying bullish options are not possible, they very much are, I just caution against using EWT to validate them.
Courtesy of the rally from the October low, a breadth thrust signal triggered. On average, this signal is seen only once every 4 years, and it has correctly predicted the market’s direction every time since 1971 for the ensuing 6, 9 and 12 months.
This breadth thrust signal provides not only a blue print of what’s ‘supposed to’ happen, it also provides a ‘this time is different’ warning level.
The details of this breadth thrust and whether the massive chart gaps left open by the rally from the October low need to get filled are available via the Profit Radar Report.
The Profit Radar Report comes with a 30-day money back guarantee, but fair warning: 90% of users stay on beyond 30 days.
Barron’s rates iSPYETF a “trader with a good track record,” and Investor’s Business Daily writes “Simon says and the market is playing along.
Subscribers to iSPYETF’s free e-mail newsletter receive a market outlook, usually once a week. The market outlook below was sent out on November 11, 2023. If you’d like to sign up for the free e-newsletter, you may do so here (we will never share your e-mail with anyone, just as we don’t accept advertising).
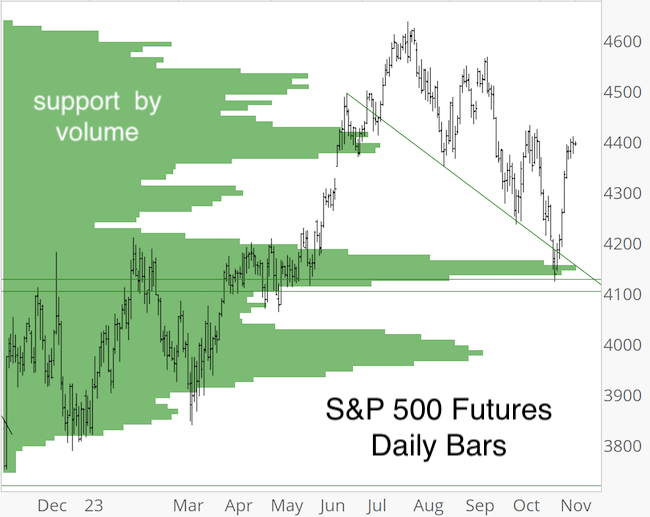
S&P 500 Futures had reached last ditch support. This support was not commonly known (after all, who’s heard of ‘support by volume’), which made it more valuable for us.
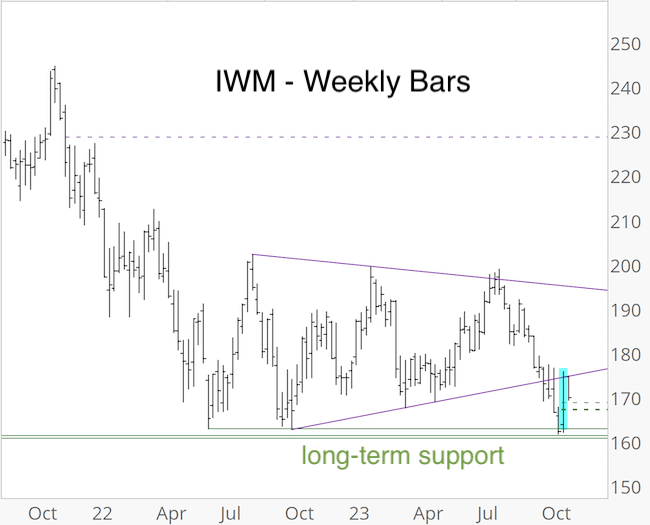
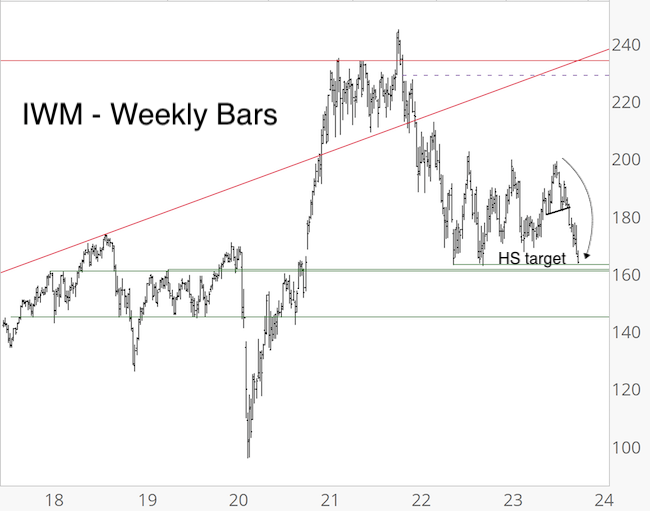
Small cap stocks, represented by IWM, also reached important long-term support. The updated charts below show how price reacted to support.
You probably read about the breadth thrusts triggered by last week’s surge. There are different kind of breadth thrusts. Some follow a strict set of criteria, others can be considered thrusts simply because their magnitude of force makes them rare enough to set its own standard.
For example, via the May 30, 2022, Profit Radar Report, I highlighted a breadth thrust strong enough to set its own standard. Here is what I observed:
“On Wednesday, Thursday, Friday, 78.57%, 82.80%, 85.94% of NYSE-traded stocks advanced on 82.49%, 86.14%, 86% of volume (3-day SMA of 82.44% advancers and 84.88% up volume).”
There were only 10 other thrusts with equal or higher force. However, more important than pointing out when a breadth thrust occurs is knowing how stocks reacted to similar conditions (or signals) in the past.
Here is how I illustrate stock’s reaction to a signal.
The various colored graphs (published in the May 30, 2022 Profit Radar Report) show S&P 500 forward performance after each prior signal.
The performance tracker, at the bottom of the image, shows:
– The S&P’s average return for 1, 2, 3, 6, 9, 12 months after the signal was given
– The percentage of time the S&P 500 showed a positive return 1, 2, 3, 6, 9, 12 months after the signal.
The actual S&P 500 performance – from May 27, 2022 to May 27, 2023 – was in line with what could be expected. The S&P 500 fell 13.98% into the October 2022 low (similar to the 2008, 2009, 2019 signals) before rallying back for a 1.14% gain 12 months later.
I mention the above breadth thrust because it was the last breadth surge that legitimately could be considered a breadth thrust. There haven’t been any since … until last week.
One of last week’s thrusts, the Zweig Breadth Thrust, is probably the most respected breadth signal. Why? Because stocks have to follow a strictly defined set of criteria to trigger a valid signal.
Signals are not very common, but common enough to provide a large enough sample size. There are a total of 11 signals since 1970 (when only counting the first signal in 12 months), the last happened on January 7, 2019.
Wednesday’s Profit Radar Report includes the forward trajectory following each prior signal, along with the performance tracker that shows the average return and odds of gains for the next 1, 2, 3, 6, 9, 12 months.
As far as signals is concerned, this one is as consistent as it gets. While I can’t guarantee future performance based on past history, I guarantee that this is the most data-based approach to investing. And with data-based, I mean making decision based on evidence.
Looking at past S&P 500 trajectories after similar signals, especially for consistent signals like the Zweig Breadth Thrust, also allows us to identify abnormalities that can be an early indication that this – normally reliable signal – is not following the usual path and may fail.
In essence, the benefit of this kind of analysis is two-fold:
– Past history projects the odds of, and magnitude of future returns.
– Failure to adhere to the normal trajectory alerts us early when an otherwise reliable signal may fail.
For continued updates, how the S&P 500 reacted to previous Zweig Breadth Thrust signals, and other purely fact based research, sign up for the Profit Radar Report.
The Profit Radar Report comes with a 30-day money back guarantee, but fair warning: 90% of users stay on beyond 30 days.
Barron’s rates iSPYETF a “trader with a good track record,” and Investor’s Business Daily writes “Simon says and the market is playing along.”
Subscribers to iSPYETF’s free e-mail newsletter receive a market outlook, usually once a week. The market outlook below was sent out on October 26, 2023. If you’d like to sign up for the free e-newsletter, you may do so here (we will never share your e-mail with anyone, just as we don’t accept advertising).
To be honest, I got a little more than I bargained for when I wrote the following in the August 2, Profit Radar Report:
“As mentioned in Sunday’s update, the setup for a S&P 500 correction was there. I am hoping stocks will drop further. A move into the 4,300s is easily possible for the S&P without causing any major technical damage.”
The S&P is now below 4,300 and it’s approaching “technical damage” territory. If price doesn’t recover soon, risk of a wash-out decline increases.
Technical damage means different things to different people, and rightfully so (there are usually different technical patterns in play).
Via the July 23 Profit Radar Report, I outlined why a correction was likely. That correction was either going to be:
1) Rather shallow and only bearish for a few months or
So, “technical damage” means that the S&P 500 is nearing the zone where scenario 1) is becoming less likely (based on Elliott Wave Theory).
S&P 500 Futures paint a similar picture, but offer one more line of support. The green bars reflect volume by price. Most investors are used to looking at daily volume action, but looking at which price levels have been most heavily traded over the past year provides an interesting take on support.
Similar to the S&P 500, small cap stocks represented by IWM are nearing an important zone, important for a number of reasons:
1) The September 20, PRR stated: “IWM broke below support around 182 and the neckline. RSI-35 is trading heavy as well. Based on a nearly over-sold RSI-2, a bounce to re-test the neckline is possible, but unless price closes back above 183, the trend for IWM is seen to be down with a test of the 160s possible.”
2) As the weekly chart shows significant support provided by various previous highs.
IWM is now in the low 160s and reached my down side target. However, a break below 160 could lead to another 10% loss.
Although the potential for technical damage has increased, don’t put the cart before the horse. This time of year is a seasonally strong period, and the more negative the media and investors get, the higher the odds of a bounce will become.
I could share many more charts and data points, but here’s everything distilled into one sentence: As long as the S&P 500 stays below resistance, we have to allow for more down side (this is essentially the same as shared in the last Market Outlook: “since RSI-35 confirmed today’s low, I am actually anticipating overall lower prices as long as the S&P cannot close back above 4,450.”).
For continued updates, purely fact based research, and objective analysis, sign up for the Profit Radar Report.
The Profit Radar Report comes with a 30-day money back guarantee, but fair warning: 90% of users stay on beyond 30 days.
Barron’s rates iSPYETF a “trader with a good track record,” and Investor’s Business Daily writes “Simon says and the market is playing along.”
Subscribers to iSPYETF’s free e-mail newsletter receive a market outlook, usually once a week. The market outlook below was sent out on September 21, 2023. If you’d like to sign up for the free e-newsletter, you may do so here (we will never share your e-mail with anyone, just as we don’t accept advertising).
Days like today, especially after a poor summer like this year, make investors wonder how bad things can get.
Below is a S&P 500 chart published previously. Before you call me a fear monger though, please keep in mind that:
1) This chart (left portion) was published all the way back in the July 23 Profit Radar Report
2) There is also great news!
While the labels on the July 23 chart reflect the most bearish option, note that the July 23 Profit Radar Report outlines two options:
“The Elliott Wave Theory (EWT) structure is at a point where a pullback is becoming more likely. Shown in the chart below is the most bearish version, but the advance could also be 1, 2, 3 instead of A, B, C. An upcoming decline could be a more shallow wave 4 or severe wave C (red). Based on the Risk/Reward Heat Map, the bearish version is very unlikely, but not impossible.“
The correction came ‘right on time,’ and the blue box (right portion) highlights the price action since July 23 and updates the EWT labels to reflect the bearish (A, B, C) and less bearish option (1, 2, 3 … 4, 5).
As a side note, the wave structure for AAPL is similar and AAPL also put in a textbook top. Detailed analysis was published in the last Market Outlook.
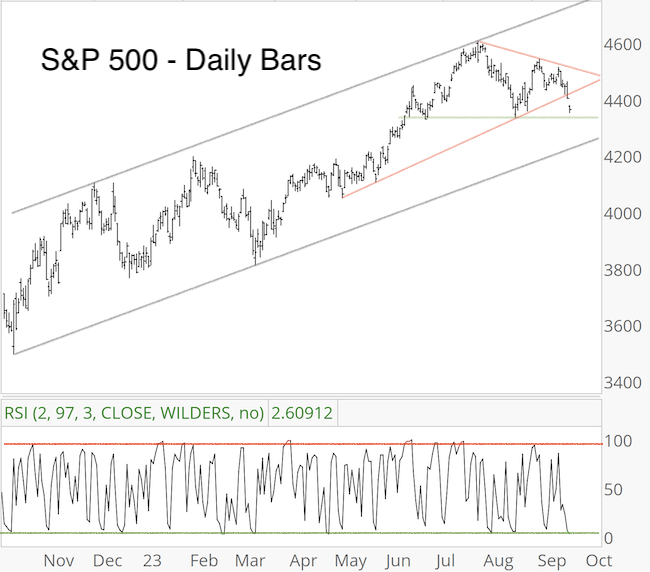
The next chart zooms in on the S&P 500 rally from the October 2022 low and includes some additional short-term support and resistance levels.
Are you ready for some great news?
Here is the first installment of the great news: The August 2, 2023 Profit Radar Report stated that: “The setup for a S&P 500 correction was there. I am hoping stocks will drop further. A move into the 4,300s is easily possible for the S&P without causing any major technical damage.”
The S&P has now reached my initial target. RSI-2 is nearing oversold and next support is around 4,340 (extending to 4,320). This is the first inflection zone since hitting the July high.
This doesn’t guarantee the correction is over, but it’s a zone worth watching for a bounce or more (since RSI-35 confirmed today’s low, I am actually anticipating overall lower prices as long as the S&P cannot close back above 4,450).
Here is the second installment of the great news: Regardless of how low the S&P may go, it is almost certain to come back and at minimum challenge the July high around 4,600. Why so?
It’s for the same reason that on September 25, 2022 – when the S&P traded at 3,693.23 – I stated the S&P will minimally rally to 4,218.
This tiny, little-known indicator has helped me disarm countless sell offs, and even crashes and assure subscribers that the S&P 500 will come back to challenge the highs. It has been 100% accurate since the 2009 bear market low.
If you read these updates regularly, you already know about this incredibly helpful indicator. If not, sign up for the Profit Radar Report, I’ll revisit this topic again in Sunday’s update.
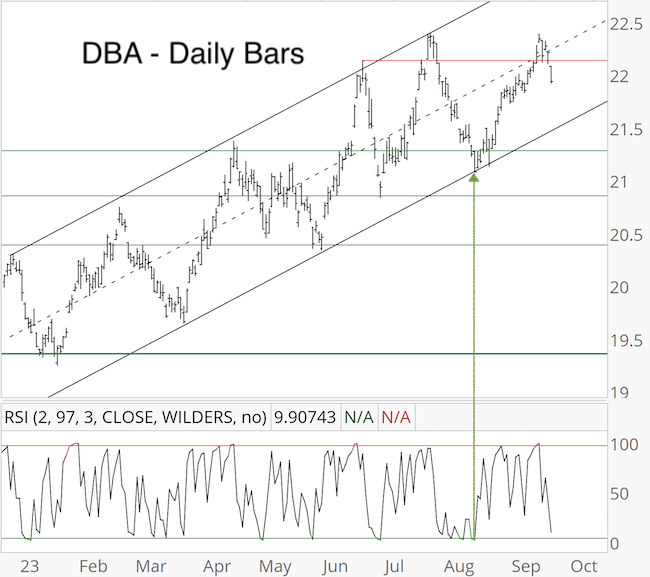
While the S&P 500 has been stagnant (trading at the same level today as June 13, 2023 and April 22, 2022), we’ve found opportunity elsewhere.
We bought DBA on August 21, when it tested trend channel support with RSI-2 over-sold.
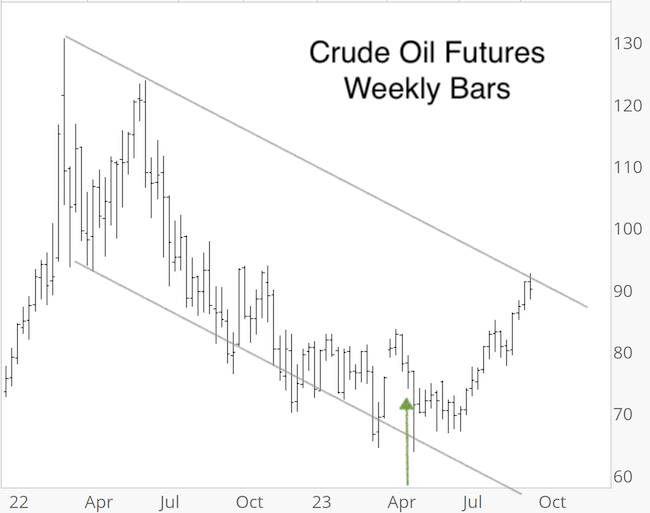
We bought crude oil back in April. Although it was a rough trade initially, we stuck with that position as an eventual rally was expected.
Crude oil has surged lately, and tagged resistance. Although the recent pullback appears temporary, w locked in profits and are observing how price deals with overhead resistance.
For continued updates, purely fact based research, and objective analysis, sign up for the Profit Radar Report.
The Profit Radar Report comes with a 30-day money back guarantee, but fair warning: 90% of users stay on beyond 30 days.
Barron’s rates iSPYETF a “trader with a good track record,” and Investor’s Business Daily writes “Simon says and the market is playing along.”