Smoke Under the Hood While Firing on All Cylinders


Subscribers to iSPYETF’s free e-mail newsletter receive a market outlook, usually once a week. The market outlook below was sent out on July 8, 2021. If you’d like to sign up for the free e-newsletter, you may do so here (we will never share your e-mail with anyone, just as we don’t accept advertising).

Here is the S&P’s ‘resume’ for the first half of 2021 (how time flies!):

– S&P closed 5 consecutive months at an all-time high

– S&P closed April, May, June at an all-time high

– S&P gained 14.4%

– S&P delivered one of the most persistent H1 rally ever

That’s obviously impressive, especially after what happened 2020. The question is this: Have stocks come too far or will momentum push them higher?

To get a clue, I’ve identified times when the S&P 500 met at least 1 of the 4 criteria mentioned above. The search resulted in 45 dates, 10 of them met multiple (1 of them all) of the 4 criteria.

S&P 500 performance following the signal dates has been downright mind-boggling with a directional consistency of up to 88%.

The full study along with S&P 500 forward returns for each instance (including the one that met all 4 criteria), average return, odds of positive performance, etc. is available in the July 5 Profit Radar Report.

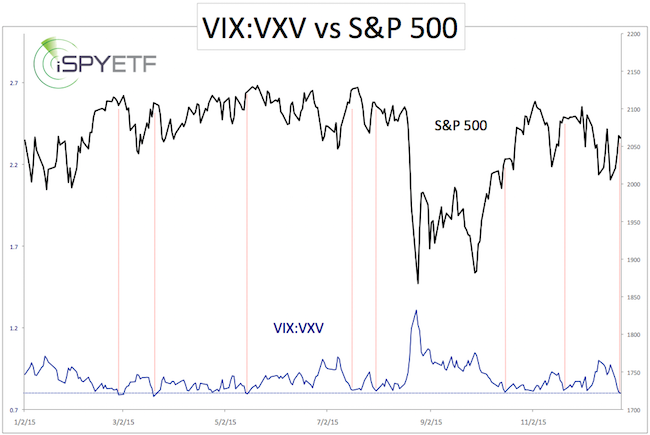
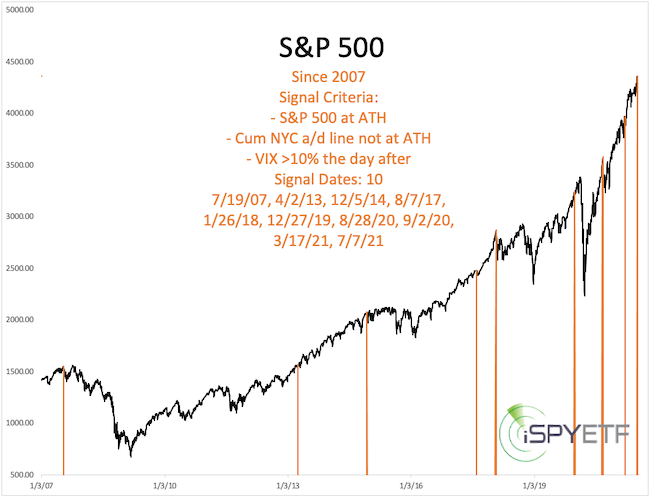
The VIX is up 13% today, which comes after a S&P 500 all-time high against a bearish NY Composite advance/decline line divergence yesterday.

This has happened only 9 other times since 2007. As the chart below shows, 5 of those 9 times preceded corrections (at times quite nasty ones). The other 4 times were quite bullish for stocks.

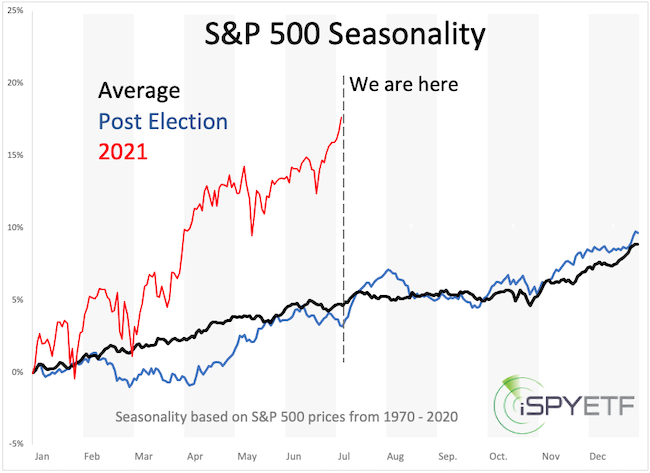
Courtesy of the pandemic, seasonality has become less effective, but it’s still one of the factors I monitor. The chart below compares YTD S&P 500 performance with regular and post election year seasonality.

July is a strong month in post election years … but then June was supposed to be flat … and was everything but.

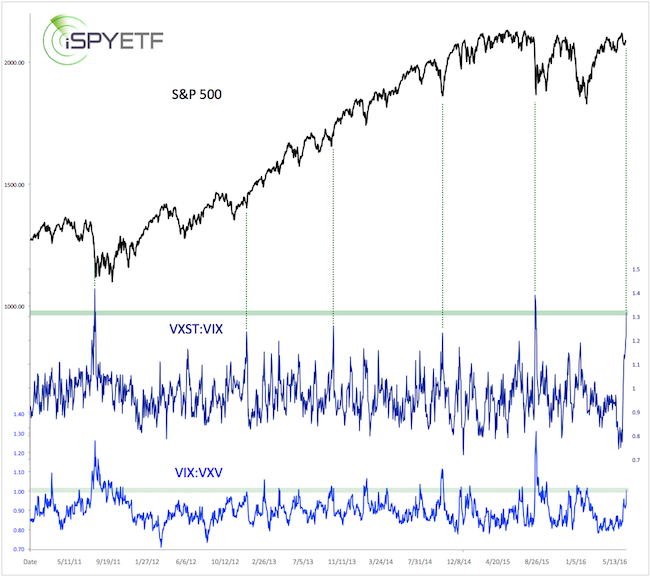
More intriguing than S&P 500 seasonality is VIX seasonality right now. The June 13 Profit Radar Report stated that:

The VIX is sliding lower with support at 13.50 – 15. VIX seasonality projects the biggest low of the year around late June.”

On July 28, the VIX traded as low as 14.10 and spiked as high as 21.29 since, a 51% move. That’s why I still look at seasonality.

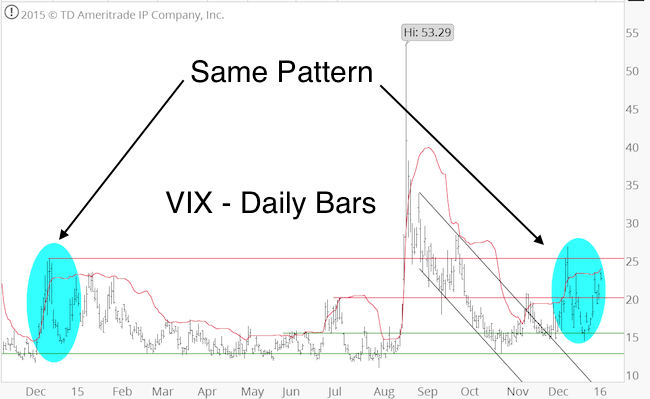
The July 5 Profit Radar Report highlighted that the S&P 500 had closed higher 9 of the last 10 session, a pretty rare feat.

Interestingly, this also happened not too long ago with a very similar looking pattern but on a larger scale. The blue chart insert below also shows the ‘big brother 9 of 10.’

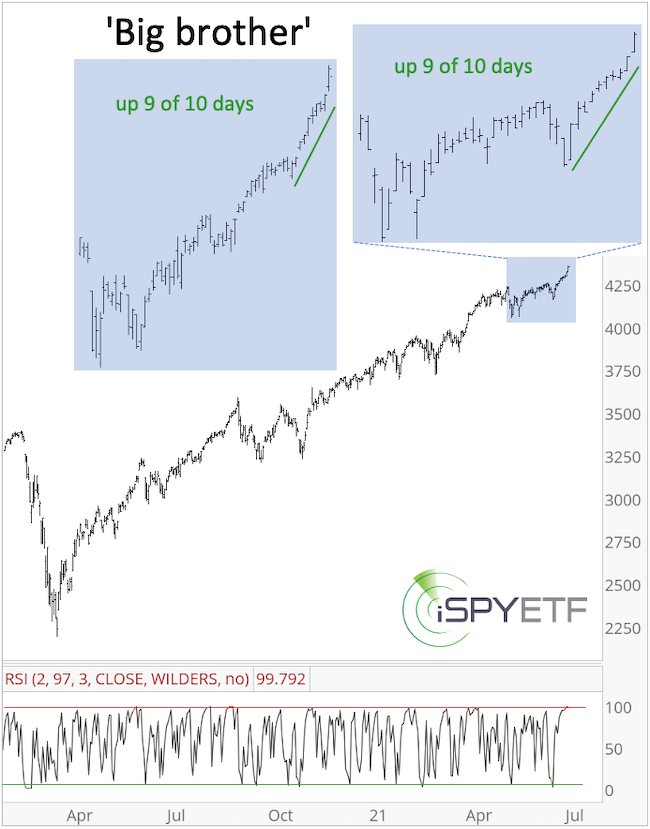
Will the outcome be the same (the exact location of the ‘big brother 9 of 10’ was highlighted in the July 5 Profit Radar Report)?

There actually were more unique developments to share – such as extremely weak breadth as the S&P 500 is trading at all-time highs – but the bottom line is simple:

Long-term momentum is strong, but we are seeing some ‘smoke under the hood.’ Thus far the car (aka stocks) is still moving forward and we don’t want to throw ourselves in front of a moving car, but we’d also think twice about buying any such car.

Continued updates, out-of-the box analysis and forward performance based on historic precedents are available via the Profit Radar Report

The Profit Radar Report comes with a 30-day money back guarantee, but fair warning: 90% of users stay on beyond 30 days.

Barron’s rates iSPYETF a “trader with a good track record,” and Investor’s Business Daily writes “Simon says and the market is playing along.”

How Alarming is the 23-year VIX Low?

According to Barron’s, the VIX is flashing a stock market warning. Barron’s is not alone. If you threw a water balloon in a room filled with analysts, odds are you’ll hit someone who’s bearish stocks because of the VIX.

Facts Trump Opinions

VIX readings below 10 are rare. There’ve only been 9 other ones since the VIX’s inception in 1993. None of them led to stock market crashes (click here for detailed analysis).

Some claim that the 2000 and 2007 market tops were preceded by a low VIX, but that’s one of the biggest misconceptions on Wall Street.

This special report, published by the Profit Radar Report on June 16, 2014, showed why the VIX was TOO LOW for a major market top back then (and still is today).

VIX Seasonality

VIX seasonality supports overall lower readings until the major seasonal low in early July.

Barron’s rates iSPYETF as “trader with a good track record” and Investor’s Bussines Daily says “When Simon says, the market listens.” Find out why Barron’s and IBD endorse Simon Maierhofer’s Profit Radar Report.

VIX-based Indicators

The chart below plots the S&P 500 against the VIX, VIX/VXV ratio, CBOE equity put/call ratio, and contango.

The VIX/VXV ratio gauges fear of short-term volatility (30-day, VIX) compared to longer-term volatility (90-days, VXV). Readings above 1 happen when investors are more concerned about the short-term than longer-term.

This occurs near stock market lows and has been a very reliable buy signal. The April 16 Profit Radar Report noted the VIX-sell signal highlighted in green (VIX is down 39% since).

On Monday, the VIX/VXV ratio was 0.776. Readings below 0.76 happen when investors are more concerned about the longer-term than the short-term.

Although a potential warning sign, the VIX buy signal (<0.77) has not been as accurate as the VIX sell signal (>1.0).

The CBOE equity put/call ratio and contango are showing a measure of bearish (for stocks) potential, but have plenty room to become more extreme.

S&P 500 Outlook

The April 11 Profit Radar Report published the chart below along with the following forecast: “As long as trade remains above 2,330, we are still looking for higher prices. The chart below outlines two potential up side targets (2,365 – 2,375 and 2,380 – 2,410).” The upside target was revised to 2,405 – 2,410 on April 26 (more detailed outlook available here).

The S&P is now just below 2,410. It remains to be seen whether bears will take a stand, but if they do, it should be around 2,410 (which would result in a VIX spike).

Continued analysis for the S&P 500, VIX and other asset classes is available via the Profit Radar Report.

Simon Maierhofer is the founder of iSPYETF and the publisher of the Profit Radar Report. Barron’s rated iSPYETF as a “trader with a good track record” (click here for Barron’s profile of the Profit Radar Report). The Profit Radar Report presents complex market analysis (S&P 500, Dow Jones, gold, silver, euro and bonds) in an easy format. Technical analysis, sentiment indicators, seasonal patterns and common sense are all wrapped up into two or more easy-to-read weekly updates. All Profit Radar Report recommendations resulted in a 59.51% net gain in 2013, 17.59% in 2014, and 24.52% in 2015.

Follow Simon on Twitter @ iSPYETF or sign up for the FREE iSPYETF Newsletter to get actionable ETF trade ideas delivered for free.


3 Must Know Brexit Vote Facts

Up until now, iSPYETF did not participate in the Brexit discussion. Why? Until the votes are cast and counted, it’s all speculation. We can’t predict the outcome of the vote and how the market reacts.

The best thing we can do is look at our dashboard of indicators and decipher their message. Based on our indicators, the Profit Radar Report anticipated a pullback in early June, but stated on June 15 that: “Following five consecutive down days, the S&P is compressed and prone to bounce. Based on Elliott Wave Theory, this bounce should stop at 2,090 – 2,110.”

We are right at 2,110, just a few hours before Britain heads to the polls.

As the vote is imminent, there are three absolute must know facts:

  1. Timing
  2. Bullish/Bearish VIX Pattern
  3. S&P 500 Coiling Pattern

1) Timing

According to the BBC, polls will close on Thursday at 22:00 GMT (3:00pm PST, 6:00pm EST). The ballot count is expected to start as soon as the polling stations close. Credit Suisse estimates that about 25% of the votes will be counted by 3:00am GMT (8:00pm PST, 11:00pm EST), 50% of the votes will be counted by 4:00am GMT (9:00pm PST, 12:00am EST).

There will be a rolling total so the time at which one side reaches the point of being mathematically unbeatable depends on how quickly the vote are counted and how close the results are running. Some expect the final result on Friday around 7:00am GMT (12:00am PST, 3:00am EST).

In other words, Wall Street will likely be closed when the results come in. This may well result in a gap up or gap down open on Friday morning. Risk adverse investors who don’t want any voting-related risk, should close out positions before the end of close today.

2) Bullish/Bearish VIX Pattern

There are three different volatility indexes:

  1. CBOE Short-term Volatility Index (VXST): Expectations of 9-day volatility
  2. CBOE Volatility Index (VIX): Expectation of 30-day future volatility
  3. CBOE 3-Month Volatility Index (VXV): Expectation of 3-month volatility

Looking at the volatility correlation between various time frames can provide helpful clues.

For example, the expectation of increased short-term volatility relative to long-term volatility (VIX/VXV ratio above 1, or VXST/VIX ratio above 1.2) is usually a contrarian indicator. When investors brace themselves for more immediate volatility, the opposite tends to happen and stocks move higher. Investors are bracing themselves right now.

The first chart plots the S&P 500 against the VXST/VIX and VIX/VXV ratio. Short-term volatility is elevated relative to longer-term volatility.

The VXST/VIX ratio is at 1.31. The dashed green lines show that similar readings in the past coincided with market lows. The VIX/VXV ratio is at 1, which is elevated as well.

However, VIX seasonality is nearing the best buy signal of the year.

S&P 500 Coiling Pattern

Based on Elliott Wave Theory, the S&P 500 is at or near a significant inflection point (fork in the road).

Summary

According to the charts, stocks are at or near an important inflection point, and the Brexit vote may be the catalyst for the next move.

The market could break into either direction. Now is the time to watch important support/resistance levels. Trade above resistance is likely to send stocks significantly higher, while a drop below support should lead to a sizeable correction.

Continued S&P 500 analysis is available via the Profit Radar Report.

Simon Maierhofer is the founder of iSPYETF and the publisher of the Profit Radar Report. Barron’s rated iSPYETF as a “trader with a good track record” (click here for Barron’s profile of the Profit Radar Report). The Profit Radar Report presents complex market analysis (S&P 500, Dow Jones, gold, silver, euro and bonds) in an easy format. Technical analysis, sentiment indicators, seasonal patterns and common sense are all wrapped up into two or more easy-to-read weekly updates. All Profit Radar Report recommendations resulted in a 59.51% net gain in 2013, 17.59% in 2014, and 24.52% in 2015.

Follow Simon on Twitter @ iSPYETF or sign up for the FREE iSPYETF Newsletter to get actionable ETF trade ideas delivered for free.


VIX is Following 2014/2015 Pattern

The December 13, 2015 Profit Radar Report first suggested that the VIX is following a pattern last seen in December 2014.

The blue circles below highlight this correlation.

The December 27, 2015 Profit Radar Report again referred to this correlation, and stated that: “The VIX painted a potential reversal candle and is likely to chop higher.”

The notion of a rising VIX was confirmed by VIX seasonality and the VIX/VXV ratio.

The December 27 update also featured this VIX/VXV chart and commentary:

The VIX/VXV ratio is at the bottom of its 2015 range. The VIX measures expected 1-month volatility, VXV measures expected 3-month volatility. The current VIX/VXV ratio reflects more long-term fear than short-term fear, which ironically tends to leads to increased short-term volatility (and lower S&P 500 prices) more often than not.”

The VIX is up 48% since and is now testing the upper Bollinger Band (red line) like it did on January 7, 2015. A move to the UPP generally means the move is stretched, at least short-term.

Simon Maierhofer is the publisher of the Profit Radar ReportThe Profit Radar Report presents complex market analysis (S&P 500, Dow Jones, gold, silver, euro and bonds) in an easy format. Technical analysis, sentiment indicators, seasonal patterns and common sense are all wrapped up into two or more easy-to-read weekly updates. All Profit Radar Report recommendations resulted in a 59.51% net gain in 2013 and 17.59% in 2014.

Follow Simon on Twitter @ iSPYETF or sign up for the FREE iSPYETF Newsletter to get actionable ETF trade ideas delivered for free.


3 Tricks for Trading the VIX

More than any other asset class, the Volatility Index (VIX) is subject to distinct patterns or biases that either help or hurt investors.

Being aware of the 3 VIX tricks discussed below will significantly increase the odds of a winning trade.

1) VIX Seasonality

I invite you to inspect the VIX seasonality chart below. Based on 25 years of trading history, there are two important seasonal turning points: July 2 and October 9.

The VIX has a strong tendency to move higher starting in early July (green arrow), and to move lower after early October (red arrow).

For example, the June 23, 2015 Profit Radar Report stated that: “The VIX closed below the lower Bollinger Band for the first time since June 6, 2014. A close back above the lower Bollinger Band will be a buy signal. VIX seasonality is soon turning higher for the best VIX seasonal signal of the year.”

Shortly thereafter the VIX rallied from 12 to 20 and eventually to 50.

Due to the massive summer spike, this year’s October sell signal was shifted.

Nevertheless, the November spike (last chart, red arrow) offered a good setup to short the VIX, as the November 16 Profit Radar Report brought out: “The VIX closed below the upper Bollinger Band, which is a sell signal.”

The October sell signal is particularly intriguing because it gets magnified by a major bias of inverse VIX ETPs (Exchange Traded Products, such as ETFs and ETNs). This bias can be worth 0.25% per day for weeks.

2) Inverse VIX Bias

ETPs like the iPath S&P 500 VIX ETN (VXX) or the VelocityShares Daily Inverse VIX ETN (XIV) use futures (or options) to replicate VIX-related performance.

The performance of futures-based ETPs is typically cannibalized by a condition called contango. However, a bet on lower VIX prices allows investors to turn this generally harmful condition into a superbly beneficial tail wind.

Below is an admittedly dry explanation of contango, but I think you will find it well worth your time (no pain, no gain).

The VIX quoted in-day-to-day life is the CBOE Volatility Index (VIX) spot price (today’s VIX price). However, the futures used to create VIX ETPs are based on the future VIX price, which is almost always more expensive than the spot price. Over time the more expensive VIX futures decline in value, eventually converging with the spot price at expiration.

As time goes by, ETF providers are forced to continuously replace expiring futures with new (more expensive) futures (this process is called ‘rolling over’). The further away the futures expiration date, the bigger the time premium. This time premium and resulting value decay is called contango.

Contango generally exists when the VIX is trading below 20. The opposite of contango – backwardation, when future VIX prices are lower than at present – generally appears when the VIX trades above 20.

I wrote a detailed report on how to actually make contango work for investors back on August 24, 2014 (entire report available to subscribers of the Profit Radar Report).

Below are some of the findings and charts shared in this report:

The two biggest beneficiaries of the ‘reverse contango’ benefit are the VelocityShares Daily Short-term VIX ETN (NYSEArca: XIV) and ProShares Short VIX Futures ETF (NYSEArca: SVXY).

The chart below compares the VIX with its inverse counter part, XIV. Shown is the cumulative percentage return from January 3, 2011 to August 15, 2014.

It quickly becomes obvious that XIV has risen much more than the VIX has fallen.

XIV is an inverse VIX ETN. For an apples to apples analysis of the excess return, here is a comparison between XIV and an inverse VIX (the VIX inversed).

  • Of the 911 trading days from January 3, 2011 to August 15, 2014, the inverse VIX had 484 up days and 427 down days. The inverse VIX had 1.13x more up than down days.
  • The average gain of 484 up days was 4.55%. The average loss of 427 down days was 5.85%. The average loss was 1.28x greater than the average gain.
  • Of the 911 trading days from January 3, 2011 to August 15, 2014, XIV had 522 up days and 389 down days. XIV had 1.34x more up than down days.
  • The average gain of 522 up days was 2.63%. The average loss of 389 down days was 3.18%. The average loss was 1.21x greater than the average gain (see figures 5 and 6).
  • From January 3, 2011 to August 15, 2014, XIV outperformed the inverse VIX by 217% (0.24% per day).

Obviously the reverse contango benefit doesn’t guarantee a profitable trade, but on average XIV provides a ‘daily edge’ of 0.25%. At times, the edge is much more pronounced, such as on November 30, 2015, when the VIX rose 6.68%, but XIV gained 0.74% (when it should have lost some 6.68%).

VIX Technical Analysis

As you may have noticed from the two above Profit Radar Report quotes, the Bollinger Bands can be very helpful when it comes to spotting buy/sell signals, especially when they occur near the two major seasonal turning points (see chart below).

Simple support/resistance levels and trend channels can also be of help. The green/red arrows below highlight the buy/sell signal given by the Profit Radar Report.

Summary

Seasonality and technical analysis triggered a VIX sell signal on November 16.

The sell signal remains active and the ‘contango tailwind’ should by overall positive for XIV until late December.

However, for the first time since the start of the 2009 bull market, we are seeing signs of distribution (liquidity is drying up). This could become an issue when the next (bullish) VIX turning point arrives.

Simon Maierhofer is the publisher of the Profit Radar Report. The Profit Radar Report presents complex market analysis (S&P 500, Dow Jones, gold, silver, euro and bonds) in an easy format. Technical analysis, sentiment indicators, seasonal patterns and common sense are all wrapped up into two or more easy-to-read weekly updates. All Profit Radar Report recommendations resulted in a 59.51% net gain in 2013 and 17.59% in 2014.

Follow Simon on Twitter @ iSPYETF or sign up for the FREE iSPYETF Newsletter to get actionable ETF trade ideas delivered for free.

VIX Seasonality Approaching Key Inflection Point

Based on seasonality, there are two particularly important dates for VIX traders:

  • Early July
  • Early and late October

July marks the best VIX buying opportunity of the year.

October marks the best VIX selling opportunity of the year.

Our VIX seasonality chart is based on 25 years worth of daily closing price history.

The chart below compares VIX seasonality with actual 2014 VIX performance.

The major seasonal VIX turning points were spot on in 2014 (the Profit Radar Report pointed out both of them).

The second chart compares the 2015 year-to-date VIX with VIX seasonality.

The seasonal 2015 VIX low arrived a bit early (June 23 instead of July 2).

However, the June 18 Profit Radar Report observed that: “The VIX closed at 10.57 today, the lowest reading since February 26, 2007. Today’s close was 0.04 point below the lower Bollinger Band at 10.61, suggesting that the VIX is oversold. A close back above the lower Bollinger Band is generally considered a buy signal.”

The summer VIX spike occurred during the time of year where the VIX is expected to rise.

The actual VIX high, however, occurred before the October seasonal high. Based on seasonality, there should have been another VIX spike in October. There are still a few days left for the VIX to turn lower, but the August panic VIX high certainly won’t be exceeded in 2015.

Seasonality is pointing towards lower VIX readings until mid December.

However, I would be remiss not to mention that big outlier moves, like in August/September, may alter the ideal VIX path.

That’s why the Profit Radar Report augments seasonal research with technical and sentiment analysis.

Simon Maierhofer is the publisher of the Profit Radar Report. The Profit Radar Report presents complex market analysis (S&P 500, Dow Jones, gold, silver, euro and bonds) in an easy format. Technical analysis, sentiment indicators, seasonal patterns and common sense are all wrapped up into two or more easy-to-read weekly updates. All Profit Radar Report recommendations resulted in a 59.51% net gain in 2013 and 17.59% in 2014.

Follow Simon on Twitter @ iSPYETF or sign up for the FREE iSPYETF Newsletter to get actionable ETF trade ideas delivered for free.

Strongest Seasonal VIX Buy Signal of the Year is Here

The June 23 Profit Radar Report featured the following VIX analysis:

“The VIX closed below the lower Bollinger Band for the first time since June 6, 2014. It is at the general support zone at 12. The next support zone is at 11. A close back above the lower Bollinger Band will be a buy signal.

VIX seasonality is soon turning higher for the best VIX seasonal signal of the year. Profiting from a rising VIX is always made tougher by contango, which persistently erodes returns of VIX related ETFs like VXX. Nevertheless, the best VIX buy signal of the year appears imminent. We would certainly be buyers at 11. For now, we’ll place a buy limit order (small initial amount) for VXX at 16.90.”

The significance of the close below the lower Bollinger Band was enhanced by VIX seasonality.

Seasonality is not an exact science, but 24 years of VIX history have carved out certain patterns that repeat more often than not.

One of those patterns is an early July VIX bottom.

The chart below plots the VIX against VIX seasonality. Click here for VIX seasonality chart.

Thanks to Greece, the VIX bottom may have arrived a few days earlier, making it tougher for latecomers to buy at the bottom.

Nevertheless, the VIX seasonality chart suggests we may see another opportunity to buy VIX related ETNs like the iPath S&P 500 Volatility ETN (NYSEArca: VXX) or VelocityShares Daily 2x Short-term Volatility ETN (NYSEArca: TVIX) next week.


Stocks in Freefall! Is this the Beginning of the End?

An avalanche of analysts and market ‘pros’ predicted a stock market crash in May and June. Here we are, almost half a year later. Is this the crash predicted by so many, or is it just another temporary correction?

Pardon the sensationalistic touch of this headline, but ‘is this the beginning of the end?’ is a perfectly legitimate question. Not because I’m a fear monger, but because others are.

Several months ago – in May, June and July – many analysts predicted a market crash. Here are a few headlines from that time:

  • CNBC: “I’m worried about a crisis bigger than 2008: Dr Doom” – May 8
  • Yahoo: “Beware: 2014 looking a lot like 2007” – May 23
  • CNBC: “This chart shows the market is a ticking time bomb” – June 12
  • Yahoo: “Common Sense says look out for a market top” – June 30
  • Forbes: “These 23 charts prove that stocks are heading for a devastating crash” – July 1

Although the S&P 500 gained as much as 200 points since those crash prophecies first surfaced, investors now wonder if this is the ‘big one.’ Is this the time when crash prophesies turn into reality?

A Market Top or THE Market Top?

Obviously, the September 19 highs carry some importance, after all the S&P 500 and Dow Jones lost about 8% since.

Complex Analysis Made Easy – Sign Up for the FREE iSPYETF E-Newsletter

Perhaps looking at what caused this spirited selloff may help determine if September 19 is ‘A’ market top or ‘THE’ market top.

On August 24, the Profit Radar Report published this chart and stated that: “The Dow Jones sports a possible wedge formation with resistance starting at 17,250 next week (17,400 by the end of September).”

On September 19, the wedge resistance line was at 17,350, which marked the exact top of the Dow Jones.

Consequently, the September 21 Profit Radar Report warned that: “The Dow Jones reached our up side target. This means risk is rising. The probabilities of a short-term pullback are elevated.”

Dow Jones Down Side Target

Based on the Dow’s performance, the wedge pattern is valid. The textbook down side target for a bearish wedge is its origin, which is around 15,000. One near-term down side target, identified by the October 10 Profit Radar Report, is 1,850. The S&P hit 1,850 this morning, and every time a target is met a bounce becomes likely. Nevertheless, today’s low doesn’t display the marks of a sustainable low yet.

Here is a look at a few other indicators:

Sentiment

Stocks are oversold, but sentiment is not extremely bearish. Throughout 2013 and 2014 the S&P 500 rallied as soon as it hit an oversold condition.

The October 1 Profit Radar Report warned that this time might be different, as some of the biggest declines happen when stocks don’t bounce from oversold conditions.

Seasonality

VIX seasonality is approaching a significant seasonal high. S&P 500 seasonality is turning positive in the near future (detailed VIX and S&P 500 seasonality charts are available to subscribers of the Profit Radar Report).

Seasonality doesn’t preclude further losses, but appears strong enough to eventually erase all or most of the losses accrued recently.

Conclusion

Based on the Dow’s wedge formation/target, a 13% decline is possible. However, seasonality may cushion the down side risk.

This decline appears similar to the 2010 and 2011 corrections. I personally will be looking for a specific bottoming pattern (displayed at the 2010 and 2011 lows). The actual down side price target is somewhat fluid (the specific bottoming pattern is discussed in the Profit Radar Report). Once the bottoming pattern starts developing, we should be able to identify a key support level.

No doubt, the above-mentioned crash prophets are getting to enjoy their 15 minutes of fame, but the only indicator that actually predicted the 1987, 2000 and 2007 crash suggests that bulls will stage a comeback once this selloff is exhausted. Here is a close look at this impressive indicator.

The Missing Ingredient for a Major Bull Market Top

Simon Maierhofer is the publisher of the Profit Radar Report. The Profit Radar Report presents complex market analysis (S&P 500, Dow Jones, gold, silver, euro and bonds) in an easy format. Technical analysis, sentiment indicators, seasonal patterns and common sense are all wrapped up into two or more easy-to-read weekly updates. All Profit Radar Report recommendations resulted in a 59.51% net gain in 2013.

Follow Simon on Twitter @ iSPYETF or sign up for the FREE iSPYETF Newsletter to get actionable ETF trade ideas delivered for free.

2 Contrarian Indicators Triggered Buy Signals Last Week

For much of 2014, contrarian indicators were stuck in the ‘Bermuda Triangle’ of technical analysis. They crashed, burned and drowned. However, the recent sell-off revived a number of them … with buy signals (how about that for irony).

As mentioned in the Short-Term S&P 500 Analysis, the S&P 500 nearly hit important support located at 1,902 – 1,885.

Just before the S&P 500 (NYSEArca: SPY) approached this key support cluster, there was a buy signal by two option-based indicators.

The charts and commentary below were published in the August 6 Profit Radar Report.

“The 5-day SMA of the CBOE Equity Put/Call Ratio just spiked to a two year high. Options traders are more bearish today than any other time since June 2012. Obviously 2012 and 2013 were unusual years and may not be the best benchmarks, but nevertheless this is a noteworthy extreme.”

“The VIX:VXV ratio briefly poked above 1 on August 1. This means that expected 1-month volatility (VIX) was higher than 3-month volatility (VXV). All 2012 and 2013 spikes above 1 marked lows for the S&P 500 and highs for the VIX.”

The message of various indicators was summarized as follows by the August 6 Profit Radar Report:

The longer-term S&P 500 chart shows key support at 1,885 – 1,902. This would be the ideal target for a tradable low (a drop to support at 1,850 is only a low probability). However, the 100-day SMA is at 1,913 and the August s1 pivot is at 1,910. In essence, support/resistance levels confirm the message of EWT: A low is either already in place or nearly so.”

Unfortunately, the above two indicators don’t tell us how long this bounce will last.

We will be looking at various other gauges to judge the longevity of this bounce.

One clue comes from the VIX. VIX seasonality triggered a major buy signal on July 9 (which has been spot on), but sports a brief bearish window right now.

More details here: VIX Seasonality Sports Brief Bearish Window

Simon Maierhofer is the publisher of the Profit Radar Report. The Profit Radar Report presents complex market analysis (S&P 500, Dow Jones, gold, silver, euro and bonds) in an easy format. Technical analysis, sentiment indicators, seasonal patterns and common sense are all wrapped up into two or more easy-to-read weekly updates. All Profit Radar Report recommendations resulted in a 59.51% net gain in 2013.

Follow Simon on Twitter @ iSPYETF or sign up for the FREE iSPYETF Newsletter to get actionable ETF trade ideas delivered for free.

VIX Seasonality Sports Brief Bearish Window

The CBOE Volatility Index, or VIX, has been following its general seasonal pattern rather closely, especially since the seasonal VIX low in July. Within a larger seasonally bullish period, there is a brief bearish window that may draw the VIX lower.

VIX seasonality has been an indicator worth watching.

The VIX seasonality chart projected a major seasonal low on July 9.

On July 10, the VIX spiked as much as 9.8% and on July 17, the VIX soared as much as 41.7%.

From the July 2 low at 10.28 to the August 1 high of 17.57 the VIX gained 71%.

Despite bullish VIX seasonality, the early August spike seemed overdone. The August 1 Profit Radar Report stated that:

“The VIX spiked 27% today, a kneejerk reaction similar to that of July 17. We would actually like to see another VIX spike sometime in August, and if we do we will likely buy the VelocityShares Inverse VIX ETN (NYSEArca: XIV). XIV benefits from a declining VIX.”

Here are some interesting behavioral VIX nuances:

  • Although the S&P 500 (NYSEArca: SPY) saw another low on August 7, the VIX high of August 1 remain intact.
  • Although the August 1 VIX high remained in tact, XIV dropped to another low on August 7 (the August 6 Profit Radar Report recommended to buy XIV at 35.10).

The chart below plots the VIX against XIV. Sideways trading following the August 1 VIX high resulted in lower XIV prices.

This deviation is caused by contango. Contango generally favors bearish VIX bets. Click here for a detailed explanation of contango.

Summary:

  • The VIX seasonality chart allows the following conclusions:
  • July 9 – October 9 are bullish for the VIX.
  • Within this bullish 3-month zone, there is a brief window of bearish seasonality from August 7 – August 22.
  • Any VIX rally into early October should provide a good opportunity to short the VIX.

Simon Maierhofer is the publisher of the Profit Radar Report. The Profit Radar Report presents complex market analysis (S&P 500, Dow Jones, gold, silver, euro and bonds) in an easy format. Technical analysis, sentiment indicators, seasonal patterns and common sense are all wrapped up into two or more easy-to-read weekly updates. All Profit Radar Report recommendations resulted in a 59.51% net gain in 2013.

Follow Simon on Twitter @ iSPYETF or sign up for the FREE iSPYETF Newsletter to get actionable ETF trade ideas delivered for free.