Little Known ‘Indicator’ Trumps Banking Crisis, War, Debt Ceiling, etc.

Subscribers to iSPYETF’s free e-mail newsletter receive a market outlook, usually once a week. The market outlook below was sent out on May 11, 2023. If you’d like to sign up for the free e-newsletter, you may do so here (we will never share your e-mail with anyone, just as we don’t accept advertising).

Wow, it’s already been a month since my last free Market Outlook e-mail. So, what’s new?

Not much. The market is stuck in a range, which is what we expected as per the 2023 S&P 500 Forecast.

I feel kind of bad for not posting more free updates, but unlike most online outlets that need eyeballs to drive their marketing revenue, I don’t just post (or send) catchy stuff for the sake of getting readers’ attention. My job is to inform, not to unnecessarily rile up. That’s also why iSPYETF is an ad-free zone.

Think about it, how much time have you spent (and wasted?) the last few months reading market analysis and getting your portfolio ready for the ‘next big move’?

You didn’t waste that time on iSPYETF. When there’s no change to my outlook, I don’t want to divert your attention from more important or more fun stuff to do (of course subscribers still get updates twice a week, but there hasn’t been much new to say either).

The March 3 Market Outlook (What Nobody Wants to Say) reiterated the odds of more sideways churning. Within that churning-mania, the April 2 Profit Radar Report forecast is still playing out:

It is possible that stocks will suffer a smaller pullback starting next week, recover and grind towards 4,200 – 4,300.”

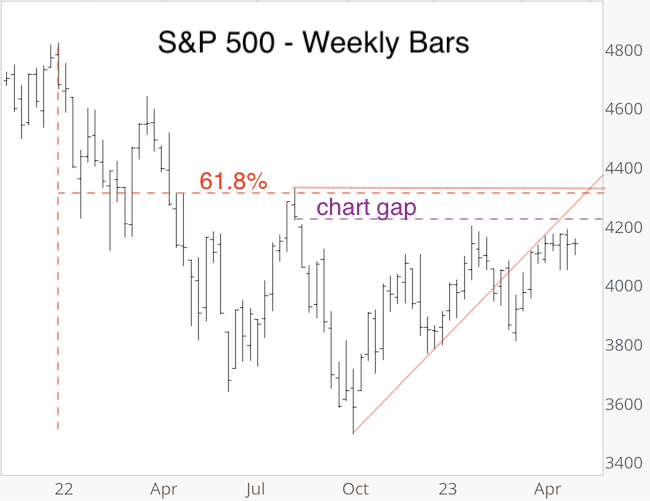
The grind to 4,200 – 4,300 is just that: A grind. Here is why 4,200 – 4,300 is a must watch zone:

– Since 2009, the S&P has closed every single down side chart gap. As mentioned in prior Profit Radar Reports (i.e. August 24, 2022: “Regardless of how much lower the S&P goes immediately, we can almost be certain that the open gap at 4,218.70 will be closed.”) we assume that at minimum the chart gap at 4,218.70 (dashed purple line) will be closed before a potentially persistent leg lower. This little-know ‘indicator’ has been more helpful in navigating the market than any other news development.

– The 61.8% Fibonacci retracement is at 4,311.29. Wave 2 counter trend rallies (bear market rallies) commonly relapse around the 61.8% level.

– There is natural resistance around the August 2022 high at 4,325.28.

The weight of evidence does not favor a major reversal (from up to down) in the 4,218.70 – 4,325.28 zone, but it remains nonetheless an inflection zone that comes with risk of a reversal. In other words, if a reversal is going to occur, it would likely be in that zone.

What About?

But what about narrow leadership? That’s been a concern for weeks. At the end of April, the entire YTD S&P 500 gain came from 8 mega cap companies. This isn’t the most healthy environment, but it’s also not consistently bearish.

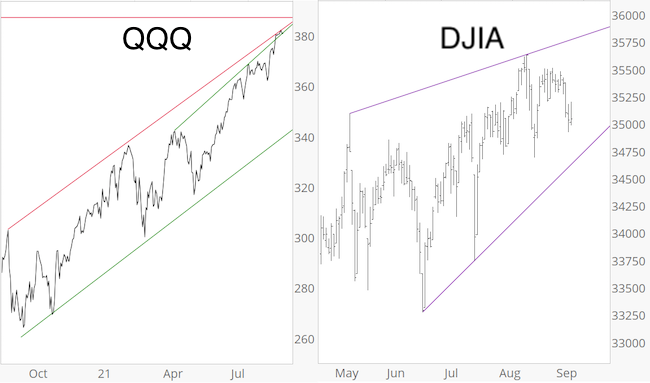
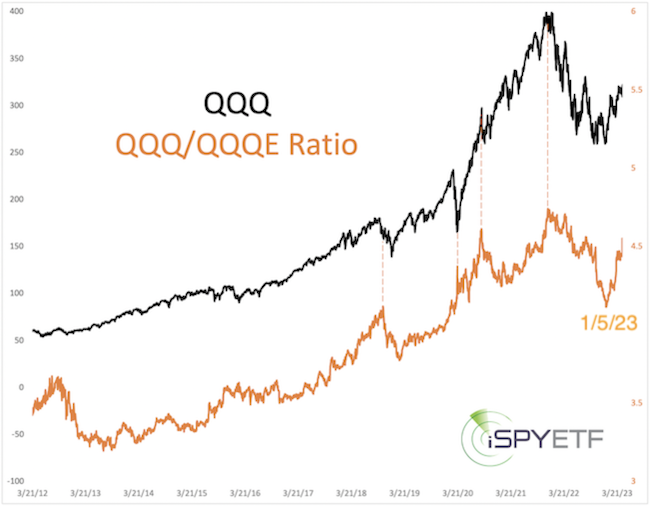
One way to provide context of mega cap outperformance is to compare the cap weighted Nasdaq-100 ETF (QQQ) to the equal weighted Nasdaq-100 ETF (QQQE, data goes back to 2012). 

The chart below plots QQQ against the QQQ/QQQE ratio. The ratio soared in 2023 (= mega cap strength). As the dashed lines show, ratio highs coincided with stock market highs in 2020 and 2021, but not every time.

It’s easy to pinpoint a ratio high in hind sight, but we don’t have that luxury in real time and we don’t know if we are at a ratio high or not. While it would be better to see broad market participation, mega cap strength does not have to be an immediate negative for stocks.

But what about the debt ceiling? Invoking the 14th amendment (I don’t comment on the legal or ethical merits of political decisions, just the potential impact on markets) could further deteriorate investors’ faith in the US government and intensify the move from public assets (I.e. government bonds) into private assets (i.e. stocks).

This mega trend continues to be one big reason why I’ve not turned outright bearish, even in 2022.

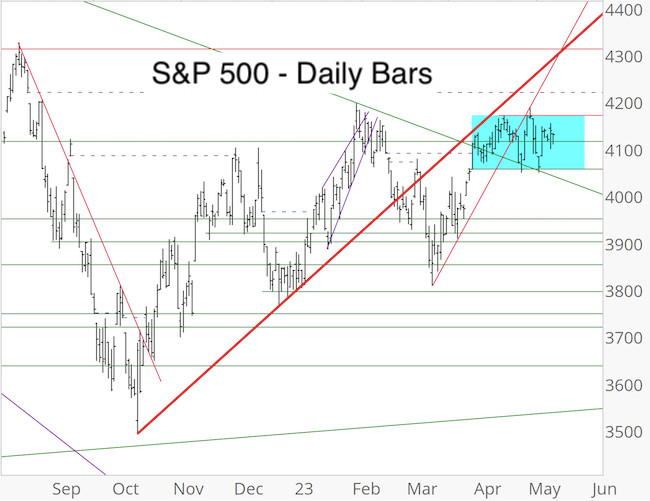
Short-term, nothing is obviously happening while the S&P 500 remains within the blue zone. Even when it finally breaks out (yes, at some point it will), I doubt that the direction of the break will be the next dominant direction.

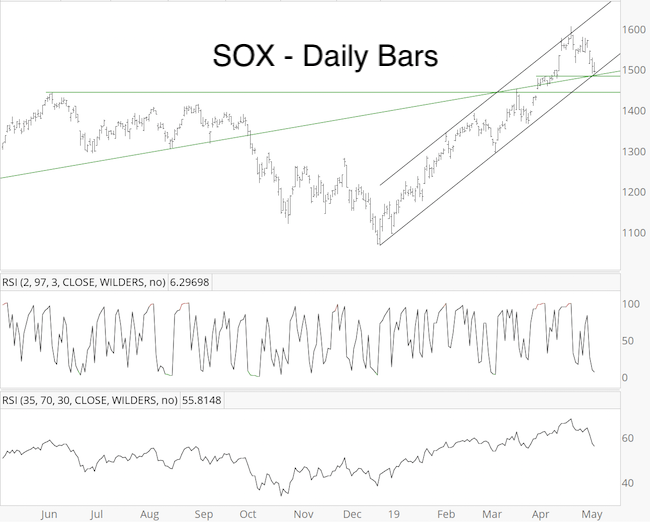
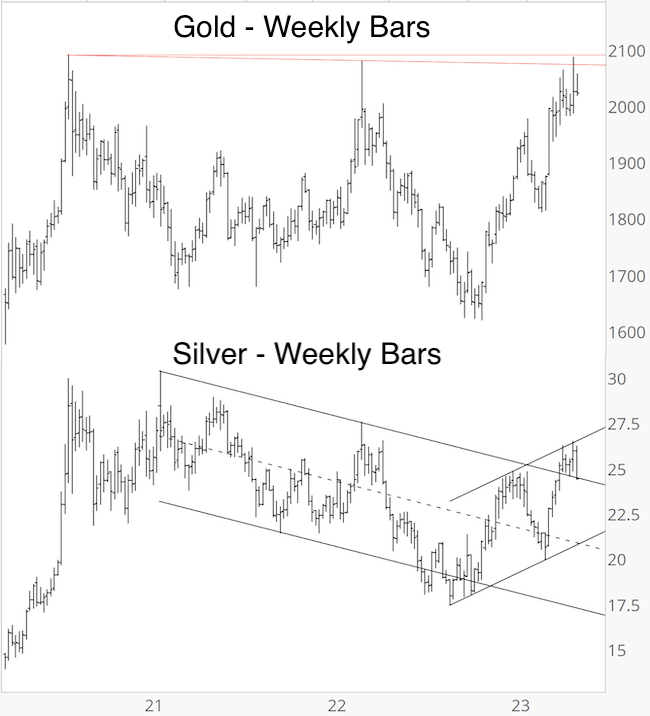
Gold and Silver have been on the verge of a breakout, but as long as the below shown resistance levels remain in place, the breakout is on hold. Notice that silver also dropped back to support today.

For continued updates, purely fact based research, and objective analysis, sign up for the Profit Radar Report

The Profit Radar Report comes with a 30-day money back guarantee, but fair warning: 90% of users stay on beyond 30 days.

Barron’s rates iSPYETF a “trader with a good track record,” and Investor’s Business Daily writes “Simon says and the market is playing along.”

S&P 500: August Highs Make Investors Cry


Subscribers to iSPYETF’s free e-mail newsletter receive a market outlook, usually once a week. The market outlook below was sent out on September 9. If you’d like to sign up for the free e-newsletter, you may do so here (we will never share your e-mail with anyone, just as we don’t accept advertising).

The S&P 500 finished August perched on an all-time high (ATH). In the past, August highs have often made investors cry.

Since 1970, the S&P carved out 12 other August ATHs (it set a 6-year high in 1979 and missed a new ATH by a few tics in 1984). All 14 signal dates (starting with the first day of September) are shown and highlighted below.

It’s tough to cram 50 years of history into one chart, but we can still see that August ATHs preceded some challenging times (i. e. 1972, 1987, 2000, 2014). Let’s drill a bit deeper.

The chart below shows the S&P 500 forward performance starting with the first day of September. The 5 instances since 2000 are shown in yellow, the 9 instances prior to 2000 are shown in gray. 2020 (in red) shattered all precedents with the exception of 1986.

As the performance tracker (bottom table) shows, returns for the next 1 – 3 months have been dismal.

The above study was just 1 of 3 studies published in Monday’s Profit Radar Report, which also featured the latest Risk/Reward Heat Map (a visual tool that shows risk based on 100s of studies).

Stocks have been immune to any kind of risk projection so we need price to verify risk with a drop below support.

Below are some basic levels to help judge risk and reward. The Nasdaq QQQ ETF is up against resistance. It will take a break above resistance to unlock higher prices (perhaps a blow off top).

DJIA is stuck in a potential wedge. A move above and back below upper wedge resistance would be a warning signal, as would be a good close below the lower wedge line.

Monday’s Profit Radar Report showed the below Bitcoin Futures chart and pointed out that price is against resistance while over-bought, which meant short-term risk was elevated. Within hours, Bitcoin dropped 10,000 points, nearly 20%. This general bias is likely positive as long black trend channel support holds.

Continued updates, out-of-the box analysis and forward performance based on historic precedents are available via the

Continued updates and factual out-of-the box analysis are available via the Profit Radar Report

The Profit Radar Report comes with a 30-day money back guarantee, but fair warning: 90% of users stay on beyond 30 days.

Barron’s rates iSPYETF a “trader with a good track record,” and Investor’s Business Daily writes “Simon says and the market is playing along.”

2021 S&P 500 Forecast, Bitcoin, Gold


Subscribers to iSPYETF’s free e-mail newsletter receive a market outlook, usually once a week. The market outlook below was sent out on January 21. If you’d like to sign up for the free e-newsletter, you may do so here (we will never share your e-mail with anyone, just as we don’t accept advertising).

Here’s your ‘broken record’ moment of the day: The tug-of-war between extreme sentiment and breadth continues as stocks grind higher (2 steps forward, 1 step back).

If you’re not yet familiar with this epic, never before seen tug-of-war, it was explained here on December 1 with the following conclusion:

Normally the combination of historic investor optimism while stocks are pressing against long-term resistance is a recipe for disaster. But, as the above studies show, strong stock market internals are likely to over-power other risk factors.

Our approach has been, and continues to be: Higher prices are likely as long as support holds.

But, extreme euphoria brings risk of a nasty pullback, so I’m also trying to discern where that risk potential might turn into reality.

The dashed trend channel center line could be a ‘pressure point’ for the iShares Russell 2000 ETF (IWM).

The detailed 2021 S&P 500 Forecast includes an actual S&P 500 price projection for 2021 based on the following factors:

  • Breadth & liquidity
  • Technical analysis (support/resistance & Elliott Wave Theory)
  • Investor sentiment
  • Seasonality & cycles
  • Valuations
  • Risk/Reward Heat Map

The latest gold analysis is available here.

The January 6 Profit Radar Report included the Bitcoin chart below along with this warning:

Bitcoin has gone parabolic, and Bitcoin futures jumped another 16.7% on Sunday afternoon. If Sunday’s pop holds, price will open above the blue trend channel on Monday, which will then act as support (around 33,000). The rally has taken the shape of a bowl (green line) and I don’t recall a ‘bowl-shaped’ rally that didn’t end badly. Based on Elliott Wave Theory, any upcoming pullback could be ‘only’ a wave 4 and not as strong as in 2018, but nevertheless, any remaining gains come with the risk of a quick 20-40% pullback.”

Bitcoin Futures are down some 30% and price is threatening to fall below the blue channel. While there is more down side risk, there’s a good chance Bitcoin will recover to new highs once this correction is over.

Continued updates and the new 2021 S&P 500 Forecast are available via the Profit Radar Report

The Profit Radar Report comes with a 30-day money back guarantee, but fair warning: 90% of users stay on beyond 30 days.

Barron’s rates iSPYETF a “trader with a good track record,” and Investor’s Business Daily writes “Simon says and the market is playing along.”S&P

Russell 2000 stuck between breadth thrust and death cross

Hitching a portfolio to small cap stocks has been a sure ticket for a rollercoaster ride.

We won’t even talk about the last two years of high volatility without any net progress. Just over the past month, the Russell 2000 went from a bullish breadth thrust to a ‘death cross.’

Will the death cross over-power the breadth thrust or vice versa?

Breadth thrust

What was the breadth thrust? From September 9 – 11, the Russell 2000 rallied more than 1% on three consecutive days. When coming from a 6-month low, that has happened only five other times over the past decade (see blue bars).

As the blue bars show, the Russell 2000 rallied strongly almost immediately every time. Despite the signal’s solid track record, the September 11 Profit Radar Report noted the over-bought condition against resistance (red line) and warned that: “The setup is not ideal for a buy signal.”

Barron’s rates iSPYETF as “trader with a good track record” and Investor’s Business Daily says: “When Simon says, the market listens.” Find out why Barron’s and IBD endorse Simon Maierhofer’s Profit Radar Report.

Death cross

Only 16 days after the breadth thrust, the Russell 2000 and corresponding iShares Russell 2000 ETF (IMW) suffered a death cross.

The red bars highlight every death cross over the past ten years. Although I’m not a fan of the fear-mongering death cross label, 1-2 months after each death cross the Russell 2000 traded lower every time. The last two death crosses (11/13/2018 and 9/2/2015) were particularly unkind.

Trouble shooting

Why did the breadth thrust fail?

Because the Russell 2000 could not make it above resistance. In fact, not only the Russell 2000 ran into resistance, the S&P 500 and Dow Jones Transportation Average did too.

I published this triple index resistance chart in the September 15, Profit Radar Report and warned that:

“The S&P 500, Russell 2000 and Dow Jones Transportation Average are at an inflection point. While the S&P 500 remains below purple trend line resistance, we allow seasonality and cycles to pull stocks back down.”

Conclusion

The two diametrically opposed Russell 2000 signals discussed above illustrate a much larger conflict. Over a month ago (September 1, Profit Radar Report) I found a lot of conflict among indicators.

Some breadth measures were strong, some weak, short-term cycles were up, but longer-term cycles down, etc.). Usually when that happens, the market stays range bound.

I personally would like to see lower prices, and the Russell 2000 death cross supports that conclusion. However, there are a number of sentiment readings that may limit down side in terms of size of length.

Continued updates, projections, buy/sell recommendations are available via the Profit Radar Report.

Simon Maierhofer is the founder of iSPYETF and the publisher of the Profit Radar Report. Barron’s rated iSPYETF as a “trader with a good track record” (click here for Barron’s evaluation of the Profit Radar Report). The Profit Radar Report presents complex market analysis (S&P 500, Dow Jones, gold, silver, euro and bonds) in an easy format. Technical analysis, sentiment indicators, seasonal patterns and common sense are all wrapped up into two or more easy-to-read weekly updates. All Profit Radar Report recommendations resulted in a 59.51% net gain in 2013, 17.59% in 2014, 24.52% in 2015, 52.26% in 2016, and 23.39% in 2017.

Follow Simon on Twitter @ iSPYETF or sign up for the FREE iSPYETF e-Newsletter to get actionable ETF trade ideas delivered for free.

5 ‘Keep it Simple’ Stock Charts and 1 Bearish Constellation

The rally from the June 3 low has created many bullish price and breadth patterns and studies (5 of them are discussed here). The market has followed through on them thus far.

However, the short-term Elliott Wave structure does not look bullish, and the long-term projection published in the June 2 Profit Radar Report (shown here) points to a serious speed bump.

In short, there is a measure of conflict between indicators. When that happens, I like to go back to the basics and keep it simple.

Resistance

The DJIA shows probably the most important resistance range to watch: around 27,300.

Support

The S&P 500 shows some important support levels to watch: around 2,910 and 2,875.

Short-term Trend Channel

The June 23 Profit Radar Report used this chart to simplify the short-term: “A break below channel support would unlock a pullback. The wave labels show the most bearish EWT-based option. It’s not ideal, but it seems more likely than other options.”

Barron’s rates iSPYETF as “trader with a good track record” and Investor’s Business Daily says: “When Simon says, the market listens.” Find out why Barron’s and IBD endorse Simon Maierhofer’s Profit Radar Report.

Trend channel support failed the next day and unlocked the biggest pullback of June. It is possible to count the decline from June 21 as 5 waves, which cautions that the trend may have changed from up to down.

Leader Fatigue

The rally from the June low has been led by defensive sectors like consumer staples. Contrary to popular belief, such (defensive-led) rallies are statistically not doomed to fail.

However, the Consumer Staples Select Sector SPDR ETF (XLP) carved out a pattern with a lot of bearish potential. I recommended to go short at 59.07 on June 13. The stop-loss is now set at breakeven, which allows us to ‘play with house money.’

Overlap

Small cap stocks represented by the Russell 2000 ETF (IWM) are lagging. In fact, IWM fell below the June 5 high. If one wanted to count the June rally as 5 waves, June 5 would be wave 1, but yesterday price dropped below the June 5 high. This creates a bearish (wave 4 / wave 1) overlap (blue arrow) that’s not allowed and voids a short-term bullish Elliott Wave count.

Bearish Constellation

Not only small caps are lagging. The transportation and banking sector are too (see chart below).

Only two other times (July 1990 and July 1998) has there been such a big divergence between the S&P 500 and small caps, transportation, and banking. This is a small sample size, but it led to a rocky and negative performance over the next quarter.

Conclusion

Even during times where there is conflict among indicators, going back to the basics provides some general guidance.

It will take a sustained move above resistance to unlock higher targets, and a break below support to unlock lower targets.

Another big but temporary drop would certainly clear up the structure and provide a lot more certainty, but we’ll let the above levels indicate whether it will happen.

Continued updates are available via the Profit Radar Report.

Simon Maierhofer is the founder of iSPYETF and the publisher of the Profit Radar Report. Barron’s rated iSPYETF as a “trader with a good track record” (click here for Barron’s evaluation of the Profit Radar Report). The Profit Radar Report presents complex market analysis (S&P 500, Dow Jones, gold, silver, euro and bonds) in an easy format. Technical analysis, sentiment indicators, seasonal patterns and common sense are all wrapped up into two or more easy-to-read weekly updates. All Profit Radar Report recommendations resulted in a 59.51% net gain in 2013, 17.59% in 2014, 24.52% in 2015, 52.26% in 2016, and 23.39% in 2017.

Follow Simon on Twitter @ iSPYETF or sign up for the FREE iSPYETF e-Newsletter to get actionable ETF trade ideas delivered for free.

5 Tempting High Reward S&P 500 Sector ETF Setups

If you like team sports, you know that a team may win even though some of its players had a bad day, or vice versa.

Just as a team is made up of individual players, the S&P 500 is comprised of individual sectors. Not all sectors perform at the same level at the same time, in fact, some may boom while others bust.

Here is a look at some sector ETF setups (boom and bust, ripe and stale):

Health Care Select Sector SPDR ETF (XLV)

The April 17 Profit Radar Report noted that the following about XLV:

The health care sector represented by XLV has taken a beating, too. XLV dropped to the lowest level since January 4, and sentiment has become extremely bearish. Purely based on sentiment, when there was so much pessimism, XLV has rallied over the next month 90% of the time, with an average gain of 5%. Seasonality is positive for the next month as well.

Aside from the green bar, there’s no ‘must hold’ support level, but RSI-2 is over-sold. We are committing a small amount to buying XLV below 86.”

We bought XLV when it dipped below 86 on April 18, and sold XLV when it became over-bought and reached the 5% average gain threshold at 90.50 and May 6.

XLV is now in neutral territory, and the setup has become stale.

Real Estate Select Sector SPDR ETF (XLRE)

The April 14 Profit Radar Report featured the chart below and stated:

The Real Estate Select Sector SPDR (XLRE) looks interesting. 3 support and resistance levels meet up to form resistance at 36.80 on Wednesday. Price is wedging higher with a small bearish divergence. Based on the wedge, the down side risk is significant if price fails to hold support. For now, we will go short if XLRE moves above 36.85 and subsequently drops below 36.50.”

Unfortunately XLRE missed my sell limited by 15 cents. After a sizeable drop, XLRE bounced from support, but a break below that support (around 35) is likely to unlock the next down side target. The potential down side risk could be significant, partially because XLRE’s sector ‘cousin’ may be in trouble.

SPDR S&P 500 Homebuilders ETF (XHB)

The May 5 Profit Radar Report pointed out that: “The SPDR S&P Homebuilders ETF (XHB) is wedging higher, and close to wedge resistance and general resistance with a bearish RSI-35 divergence. In terms of seasonality, May and June are the worst months for XHB. We will short XHB if it spikes above 41.80 and subsequently moves below 41.70 (stop-loss at day’s high). Considering futures, XHB may open lower tomorrow, and we may consider to go short on a drop below 40.70.

XHB fell below lower wedge support, which unlocks significant down side potential. RSI-2 is near over-sold, and a bounce is possible. In fact, any bounce that gets close to the broken purple trend line (such a re-test of previously broken support is often a ‘kiss good-bye’) would be another low-risk set up to go short.

Utilities Select Sector SPDR ETF (XLU)

March 27 Profit Radar Report:

The utility sector (represented by XLU) rallied to new all-time highs with more than 80% of its components at a 52-week high..

In addition, XLU was rejected by trend line resistance. Additional trend channel resistance is around 59.50. Support is around 58.20 and 57.20. There was a bearish RSI-35 divergence on the daily chart.

Based on technicals and statistics, shorting XLU has high odds of being profitable. Unfortunately XLU seasonality is very bullish for March/April. 

XLU could move a bit higher, but we will leg into a short position now (and will probably add more if it moves higher). There is no good inverse utility ETF, so we will short XLU above 58.40.”

XLU is making slow down side progress, but it’s not been able to move below support around 57 – 56.75. A move below support could unlock further down side, but immediate down side may be limited due to a near over-sold RSI-2.

PHLX Semiconductor Index (SOX)

The PHLX Semiconductor Index is often the ‘MVP’ that drives the ‘team’ to more gains (or vice versa). SOX is at a convergence of support (black trend channel and green trend line). If bulls are going to make a stand, it would be here. If not, the next stop is around 1,440.

Continued sector and stock market analysis available via the Profit Radar Report.

Simon Maierhofer is the founder of iSPYETF and the publisher of the Profit Radar Report. Barron’s rated iSPYETF as a “trader with a good track record” (click here for Barron’s evaluation of the Profit Radar Report). The Profit Radar Report presents complex market analysis (S&P 500, Dow Jones, gold, silver, euro and bonds) in an easy format. Technical analysis, sentiment indicators, seasonal patterns and common sense are all wrapped up into two or more easy-to-read weekly updates. All Profit Radar Report recommendations resulted in a 59.51% net gain in 2013, 17.59% in 2014, 24.52% in 2015, 52.26% in 2016, and 23.39% in 2017.

Follow Simon on Twitter @ iSPYETF or sign up for the FREE iSPYETF e-Newsletter to get actionable ETF trade ideas delivered for free.

Will Momentum Continue to Push Stocks Higher?

From December 3 – December 26, 2018, the S&P 500 lost 453 points. Since then, the S&P rallied 400 points.

Who would have thought that the worst December since 1931 would be followed by the best January since 1987?

Extremes Everywhere

We are truly living in a world of extremes. The rich are getting richer, the poor are getting poorer while historic heat waves and polar vortexes ravage the globe. Stock market extremes fit into the picture.

Although the relentlessness of this rally was unexpected (at least for me), the Profit Radar Report highlighted a tell tale sign of the latest buying extreme when 90% of NYSE-traded stocks advanced on January 4 (blue columns).

Barron’s rates iSPYETF as “trader with a good track record” and Investor’s Business Daily says: “When Simon says, the market listens.” Find out why Barron’s and IBD endorse Simon Maierhofer’s Profit Radar Report.

As the table and thumbnail charts below shows (originally published in the January 9 Profit Radar Report), this kind of breadth and momentum thrust is rare and almost always long-term bullish.

Confirmation?

The initial thrust is thus far confirmed by my favorite liquidity indicator (blue graph, first chart), which has already retraced 88.82% of its prior losses, significantly more than the 63% S&P 500 retracement.

A new high of the liquidity indicator prior to a S&P 500 high will be additional confirmation of further gains.

Momentum vs Over-bought

The S&P 500 ended Tuesday overbought (based on RSI-2 – bottom graph, first chart). This is not the first time the S&P has become over-bought, but in 2019 it’s been a ‘mind of matter’ pattern; As long as the market doesn’t mind, it doesn’t matter.

Red line resistance, the next potential speed bump, is around 2,745.

The Elliott Wave pattern for almost every major index is up to interpretation, but the Nasdaq-100 QQQ ETF pattern offers slightly more clarity than others.

As the chart above shows, QQQ could be completing a 5-wave move. Upon completion, a 5-wave move is followed by a correction (quite commonly a nasty one), and further gains.

One anomaly that also cautions against chasing stocks at this stage is the VIX. As the chart above shows, the VIX has fallen back to support around 15, in fact, it’s at the lowest level since October. At the same time, the S&P 500 is still below its 200-day SMA.

It’s unusual for the VIX to drop to a 3-4 month low while the S&P is still below its 200-day SMA. In fact, over the past 20 years it only happened during the 2001/02 and 2008 bear markets. Forward returns were consistently negative.

In summary, chasing stocks at this stage does not seem prudent. There should be a pullback … and who knows, perhaps the pullback also gathers momentum. We’ll evaluate when we get there.

Continued updates are available via the Profit Radar Report.

Simon Maierhofer is the founder of iSPYETF and the publisher of the Profit Radar Report. Barron’s rated iSPYETF as a “trader with a good track record” (click here for Barron’s evaluation of the Profit Radar Report). The Profit Radar Report presents complex market analysis (S&P 500, Dow Jones, gold, silver, euro and bonds) in an easy format. Technical analysis, sentiment indicators, seasonal patterns and common sense are all wrapped up into two or more easy-to-read weekly updates. All Profit Radar Report recommendations resulted in a 59.51% net gain in 2013, 17.59% in 2014, 24.52% in 2015, 52.26% in 2016, and 23.39% in 2017.

Follow Simon on Twitter @ iSPYETF or sign up for the FREE iSPYETF e-Newsletter to get actionable ETF trade ideas delivered for free.

S&P 500: Long-term Explains Short-term

In late October we were looking for a strong counter trend rally (S&P 500 projection published here), and wanted to short the S&P 500 in the 2,830 – 2,850 zone (red bar). The S&P fell short of our target, and relapsed at 2,817.

This week we wanted to buy the S&P 500 after a brief dip below trend channel support (2,615 – green bar). Again, the S&P fell short of our target, and bounced from 2,631.

Why is the market falling short of our targets, and what does it mean?

Long-term Outlook Explains Short-term Movements

Here is one explanation (in my humble opinion the most plausible one):

In mid-October I analyzed various indicators to help determine the S&P’s larger pattern, and ideally future path. Indicators included:

  • Breadth & momentum
  • Price patterns
  • Support & resistance levels
  • Liquidity & breath
  • Investor sentiment
  • Elliott Wave Theory
  • Seasonality & cycles

The entire analysis, along with the three most likely scenarios were published in the October 14 Profit Radar Report.

Barron’s rates iSPYETF as “trader with a good track record” and Investor’s Business Daily says: “When Simon says, the market listens.” Find out why Barron’s and IBD endorse Simon Maierhofer’s Profit Radar Report.

The chart and commentary below were published as scenario #1:

Scenario #1: The September high is wave 3 (primary degree). The current decline is wave 4. Waves 4 are generally choppy, drawn out, frustrating and nearly impossible to predict. Shown are the two most common Fibonacci retracement (down side) targets: 

— 23.6%: 2,500 — 38.2%: 2,228. Once this correction is complete, the stock market will rally to its final bull market high (wave 5). 

Although a new multi-year bear market with much lower targets is possible, the size of the bearish divergence at the September high and lack of absolute investor bullishness surrounding the top, suggest that scenario #1 or #2 are more likely than #3.”

“Waves 4 are generally choppy, drawn out, frustrating and nearly impossible to predict.” True to that! Although we correctly anticipated the decline from the 2,800s and the bounce from the 2,600s, the notion that the S&P is in a larger-scale wave 4 correction would explain why price keeps falling short of my targets.

Short-term Outlook

The hourly chart below, published in the November 27 Profit Radar Report, showed that 2,685 was a short-term inflection point, because that’s where a number of trend lines met up with an open chart gap.

As it turns out, the break above 2,685 uncorked quite a pop (I personally would have preferred a drop). Next resistance is not far away, but as long as trade remains above the breakout level (2,685), it can continue to move higher (likely in a choppy fashion) … and reach the 2,830 – 2,850 range missed earlier this month.

Nasdaq-100 – QQQ ETF

Unlike the S&P 500, the Nasdaq-100 QQQ carved out a bullish divergence at the November 20 low. The November 21 PRR stated that: “The Nasdaq-100 QQQ gave back most of its gains, but closed above short-term support. Since QQQ already carved out a bullish divergence, bulls already have their window of opportunity to take trade higher, as long as support around 160 holds.”

Bulls took advantage of their window of opportunity, but resistance is not far away, and RSI-2 is nearing over-bought.

Summary

First the S&P 500 missed our up side target (2,830 – 2,850), then our down side target (2,615).

This is likely caused by the unpredictable nature of choppy wave 4 corrections. Nevertheless, the weight of evidence suggests that the S&P will hit (and exceed) both of the above target zones in the coming weeks/monhts.

Continued updates are available via the Profit Radar Report.

Simon Maierhofer is the founder of iSPYETF and the publisher of the Profit Radar Report. Barron’s rated iSPYETF as a “trader with a good track record” (click here for Barron’s evaluation of the Profit Radar Report). The Profit Radar Report presents complex market analysis (S&P 500, Dow Jones, gold, silver, euro and bonds) in an easy format. Technical analysis, sentiment indicators, seasonal patterns and common sense are all wrapped up into two or more easy-to-read weekly updates. All Profit Radar Report recommendations resulted in a 59.51% net gain in 2013, 17.59% in 2014, 24.52% in 2015, 52.26% in 2016, and 23.39% in 2017.

Follow Simon on Twitter @ iSPYETF or sign up for the FREE iSPYETF e-Newsletter to get actionable ETF trade ideas delivered for free.

Are Emerging Market Stocks Ready to Rally?

From January 26 – August 15, the iShares MSCI Emerging Markets ETF (EEM) lost 20.3%. A bear market is commonly defined as a decline of 20% or more. Based on this definition, EEM entered a bear on August 15.

Will the emerging markets bear market continue, or is it a false signal?

Emerging Markets Bear Market? The ‘Two Week Rule’

To assess emerging markets future prospects, we will look at other times EEM lost 20%.

As the chart below shows, since its inception in 2004, EEM fell 20% five other times. How it performed two weeks later, tended to be an indication of its longer-term prospects.

Two weeks after its initial 20% drop, EEM was higher 3 times, and lower 2 times. 4 out of 5 times, the subsequent gain or loss was significant (>7%).

The 3 times EEM was higher two weeks later, it was also higher three months later (on average 5.7%). The 2 times EEM was lower two weeks later, it was also lower three months later (average of 3%).

The chart below shows EEM since its January high. Since ‘entering bear market territory,’ EEM already rallied more than 5%, and it looks like it will be up two weeks after triggering a 20% decline.

Trade is just below its 50-day SMA and trend line resistance around 43.80. There was a bullish RSI divergence at the low.

It seems like EEM has a good shot at moving higher, but a move above 43.80 is need to start confirming a perhaps more lasting bounce.

Other popular emerging markets ETFs include:

  • Vanguard FTSE Emerging Markets ETF (VWO)
  • iShares Core MSCI Emerging Markets ETF (IEMG)
  • Schwab Fundamental Emerging Markets Large Company Index ETF (FNDE)

Above analysis was initially published in the August 26 Profit Radar Report. Barron’s rates iSPYETF as “trader with a good track record” and Investor’s Business Daily says: “When Simon says, the market listens.” Find out why Barron’s and IBD endorse Simon Maierhofer’s Profit Radar Report.

Simon Maierhofer is the founder of iSPYETF and the publisher of the Profit Radar Report. Barron’s rated iSPYETF as a “trader with a good track record” (click here for Barron’s profile of the Profit Radar Report). The Profit Radar Report presents complex market analysis (S&P 500, Dow Jones, gold, silver, euro and bonds) in an easy format. Technical analysis, sentiment indicators, seasonal patterns and common sense are all wrapped up into two or more easy-to-read weekly updates. All Profit Radar Report recommendations resulted in a 59.51% net gain in 2013, 17.59% in 2014, 24.52% in 2015, 52.26% in 2016, and 23.39% in 2017.

Follow Simon on Twitter @ iSPYETF or sign up for the FREE iSPYETF Newsletter to get actionable ETF trade ideas delivered for free.

As mentioned in part I of “How to Outsmart a Choppy, Range-bound Market” (published on March 27), we anticipated a rollercoaster-like stock market.

Our strategy was to look for low-risk opportunities in certain industry sectors.

The April 24 Profit Radar Report stated the following:

The S&P 500 has reached a point where a bounce is likely. It’s possible that the bounce may morph into the next bigger rally. We would prefer to see even lower prices (the lower, the better the risk/reward), but we’re not certain if our wish will become reality.

We’ve been here before (February 8, April 2). Both times the S&P rallied … and eventually pulled back again. In February we bought XLU as a lower-risk bet on equities. Now XLP sports an interesting setup.”

Barron’s rates iSPYETF as “trader with a good track record” and Investor’s Business Daily says: “When Simon says, the market listens.” Find out why Barron’s and IBD endorse Simon Maierhofer’s Profit Radar Report.

Low-Risk Sector Trades

The Utility Select Sector SPDR ETF (XLU) and Consumer Staples Select Sector SPDR ETF (XLP) were over-sold and over-hated at the time. In addition they were trading against support with bullish divergences. And, paying some of the best dividends in the business didn’t hurt.

We bought XLU on February 12, and sold XLU on April 6 for a 6.16% gain.

We bought XLP on April 25, and sold XLP on May 1 at breakeven.

We again bought XLP on May 31, and sold XLP on July 10 for a 5.50% gain (yes, sometimes it may take two attempts to get it right).

If you enjoy quality, hand-crafted research, >> Sign up for the FREE iSPYETF Newsletter

At no time did XLU or XLP fall below our purchase price, and both trades offered a 11.66% (including dividends) absolutely no risk, no stress return.

The Profit Radar Report continuously looks for low-risk trade opportunities, which includes stocks, gold, silver, oil, currencies. Continued updates and recommendations are available via the Profit Radar Report.

Simon Maierhofer is the founder of iSPYETF and the publisher of the Profit Radar Report. Barron’s rated iSPYETF as a “trader with a good track record” (click here for Barron’s profile of the Profit Radar Report). The Profit Radar Report presents complex market analysis (S&P 500, Dow Jones, gold, silver, euro and bonds) in an easy format. Technical analysis, sentiment indicators, seasonal patterns and common sense are all wrapped up into two or more easy-to-read weekly updates. All Profit Radar Report recommendations resulted in a 59.51% net gain in 2013, 17.59% in 2014, 24.52% in 2015, 52.26% in 2016, and 23.39% in 2017.

Follow Simon on Twitter @ iSPYETF or sign up for the FREE iSPYETF Newsletter to get actionable ETF trade ideas delivered for free.