Gold Update – Why Didn’t Panic Send Gold Higher?

Question: As a lay person, it’s been my understanding that the price of gold will move up at times of panic. Could you pleas enlighten me as to why you recommended to short gold. Thanks! – Ben – Pasadena, CA

Answer: Many factors influence the price of gold, but panic is not one of them (at least not consistently). For example, in October 2008, the last time stocks crashed, gold lost as much as 27%. It’s ironic that many investors perceive gold to be a hedge against panic, yet gold fell hard during the two biggest panic months of our generation (October 2008 and March 2020).

Why did gold almost drop 15% in the last two weeks. 

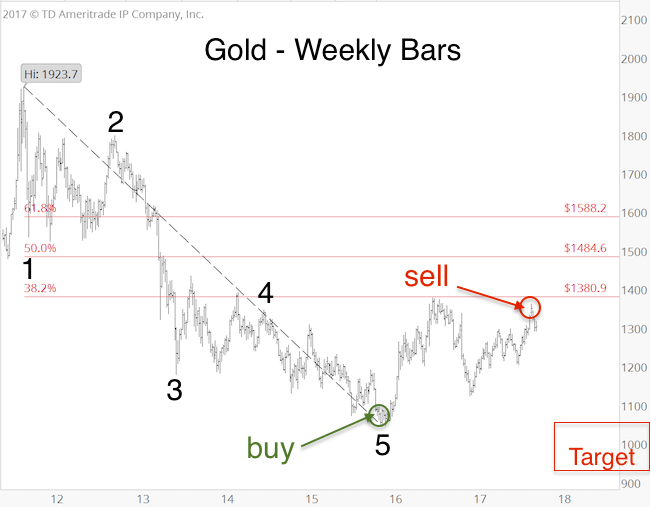
Back in January, the Profit Radar Report stated that gold is currently in limbo, but will drop sooner or later. The question was not if, but when. The January 12, 2020 Profit Radar Report recommended to leg into a short position – short via gold futures, short SPDR Gold ETF (GLD) or ProShares UltraShort Gold (GLL) – and projected the eventuality (now or later – yellow lines) via the yellow lines:

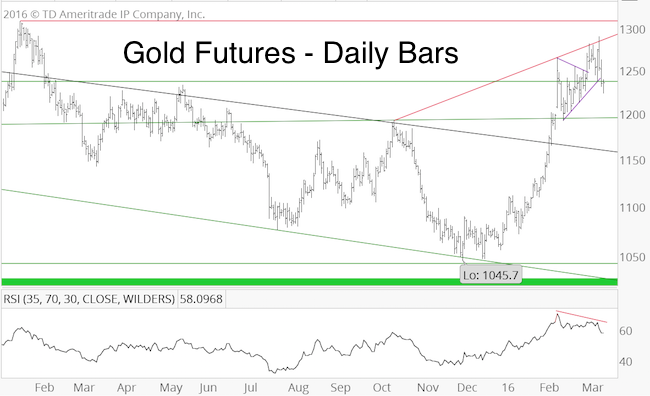
The February 23 Profit Radar Report featured this chart and warned:
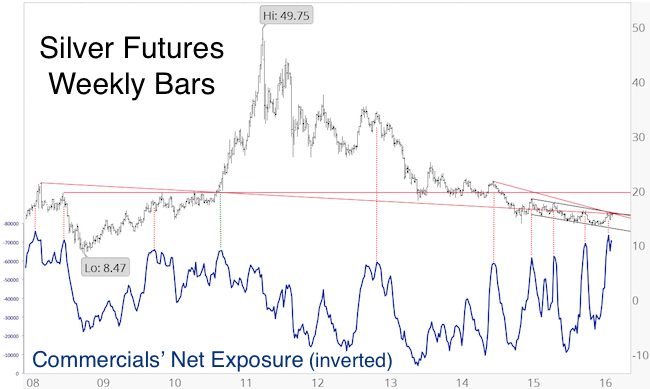
As the weekly chart shows, commercial hedgers (smart money) increased their short exposure to a new record. We’ll be looking for a low-risk entry to add to our existing short position. In fact, I’m tempted to add (or initiate) to our short exposure right now, but it’s prudent to allow for higher prices or wait for a close below 1,615.

Gold’ is likely in wave 3 of 5 or wave 5 of 5. In commodities, wave 5 is sometimes the ‘blow-off’ wave that extends higher then expected. The upper target for such an extension is in the low 1,700s, but it’s by no means required. RSI-2 is seriously over-bought, and the larger-scale bearish RSI-35 divergence remains in tact.

The red box highlighted price resistance for gold. The vertical dashed red lines outline what happened every time commercial hedgers (smart money), revved up their short exposure: Gold prices dropped, and they usually did so swiftly.

Ascertaining that gold prices were about to fall was the easy part. The question now is: How low can gold go?

Gold is likely working on a ‘sling shot’ decline, meaning that prices will jolt higher once they’ve pulled back enough. However, that pullback could be very severe. Short-term, support is around 1,450, and price could bounce from there, but ultimately I’d like to see prices drop even lower.

Continued updates, projections, buy/sell recommendations are available via the Profit Radar Report.

Simon Maierhofer is the founder of iSPYETF and the publisher of the Profit Radar Report. Barron’s rated iSPYETF as a “trader with a good track record” (click here for Barron’s evaluation of the Profit Radar Report). The Profit Radar Report presents complex market analysis (S&P 500, Dow Jones, gold, silver, euro and bonds) in an easy format. Technical analysis, sentiment indicators, seasonal patterns and common sense are all wrapped up into two or more easy-to-read weekly updates. All Profit Radar Report recommendations resulted in a 59.51% net gain in 2013, 17.59% in 2014, 24.52% in 2015, 52.26% in 2016, and 23.39% in 2017.

Follow Simon on Twitter @ iSPYETF or sign up for the FREE iSPYETF e-Newsletter to get actionable ETF trade ideas delivered for free.

Gold Update

Gold has been on fire! Up almost 10% over the past month.

I would be more thrilled about gold’s run if it hit my down side target first.

The March 3 Profit Radar Report featured this longer term projection for gold (yellow lines, chart below).

Barron’s rates iSPYETF as “trader with a good track record” and Investor’s Business Daily says: “When Simon says, the market listens.” Find out why Barron’s and IBD endorse Simon Maierhofer’s Profit Radar Report.

The March 13 Profit Radar Report provided this shorter term roadmap and target levels for a buyable low. The blue down side target boxes where around 1,260 and 1,240.

We had a buy limit for gold futures at 1,265 and for the SPDR Gold Shares ETF (GLD) at 119. Unfortunately gold stopped just shy of 1,265 (and GLD before 119) before staging a strong rally.

If you enjoy quality, hand-crafted research, >> Sign up for the FREE iSPYETF e-Newsletter

What’s Next?

The yellow projection shown in the March 3 Profit Radar Report assumed a triangle breakout followed by a relapse.

However, there is an alternate, more bullish path. Regardless, we wanted to buy gold because both scenarios pointed higher.

Now the question is whether to chase price or not? Short-term, gold is over-bought. But as long as trade remains above 1,350, trade can continue to grind higher (which would improve the odds of the more bullish path).

Continued updates and projections are available via the Profit Radar Report.

Simon Maierhofer is the founder of iSPYETF and the publisher of the Profit Radar Report. Barron’s rated iSPYETF as a “trader with a good track record” (click here for Barron’s evaluation of the Profit Radar Report). The Profit Radar Report presents complex market analysis (S&P 500, Dow Jones, gold, silver, euro and bonds) in an easy format. Technical analysis, sentiment indicators, seasonal patterns and common sense are all wrapped up into two or more easy-to-read weekly updates. All Profit Radar Report recommendations resulted in a 59.51% net gain in 2013, 17.59% in 2014, 24.52% in 2015, 52.26% in 2016, and 23.39% in 2017.

Follow Simon on Twitter @ iSPYETF or sign up for the FREE iSPYETF e-Newsletter to get actionable ETF trade ideas delivered for free.

If you enjoy quality, hand-crafted research, >> Sign up for the FREE iSPYETF e-Newsletter

Gold Update

In August 2018, gold carved out the bottom outlined via this projection published in the August 29 Profit Radar Radar Report.

Gold appears to have finished the first leg of this rally on February 20 at 1,350, which was followed by a 70-point drop.

The March 10 Profit Radar Report featured this gold chart, which projected a rally to about 1,320 followed by a drop back into the 1,250 range.

Gold made it as high as 1,325. As the updated chart shows, price dropped below the short-term black trend channel today (red arrow).

This is the first indication trade should work towards our buy target. The coming days will hopefully bring further confirmation.

Popular gold ETFs include:

SPDR Gold Trust (GLD)

iShares Gold Trust (IAU)

Continued updates are available via the Profit Radar Report.

Simon Maierhofer is the founder of iSPYETF and the publisher of the Profit Radar Report. Barron’s rated iSPYETF as a “trader with a good track record” (click here for Barron’s evaluation of the Profit Radar Report). The Profit Radar Report presents complex market analysis (S&P 500, Dow Jones, gold, silver, euro and bonds) in an easy format. Technical analysis, sentiment indicators, seasonal patterns and common sense are all wrapped up into two or more easy-to-read weekly updates. All Profit Radar Report recommendations resulted in a 59.51% net gain in 2013, 17.59% in 2014, 24.52% in 2015, 52.26% in 2016, and 23.39% in 2017.

Follow Simon on Twitter @ iSPYETF or sign up for the FREE iSPYETF e-Newsletter to get actionable ETF trade ideas delivered for free.

Gold Tug-of War: Mid-term Bullish vs Short-term Bearish

Gold has been zigzagging up and down for all of 2017. This erratic performance brings a measure of uncertainty, but – in a way – it also increases confidence in our long-term forecast.

Starting in November 2015, the Profit Radar Report expected a sizeable gold rally.

The November 30, 2015 Profit Radar Report published the chart below, which shows gold at quadruple support and record bullish smart money hedgers. An ideal setup for a rally (gold’s final low occurred on December 3, 2015 at 1,045).

The second chart shows the Elliott Wave Theory (EWT) labeling we’ve been following for the past years.

According to EWT, the first wave (comprised of five sub-waves) of the bear market ended in December 2015. The rally since is a counter trend move.

Barron’s rates iSPYETF as “trader with a good track record” and Investor’s Bussines Daily says “When Simon says, the market listens.”

Common Fibonacci target levels for this counter trend rally are 1,381, 1,485 and 1,588. Counter trends are generally more choppy and less predictable, which is true of the rally from December 2015 to September 2017 (this increases confidence in our forecast).

Since we were looking for a move above 1,382, the Profit Radar Report issued a buy signal for gold and gold ETFs like the SPDR Gold Shares (GLD) in November 2015 (gold at 1,088), and in August 2017 (gold at 1282).

On September 8, 2017 gold became overbought and touched the top of the black trend channel. Smart money hedgers (which were record bullish at the December 2015 low) turned significantly more bearish (see daily chart).

For those reasons, the Profit Radar Report issued a sell signal on September 5, 2017.

We don’t have a down side target for the current pullback (yet), but the lack of a bearish RSI-divergence at the September 8 high and failure to reach or exceed Fibonacci resistance at 1,381 suggests gold will take another stab at new recovery highs.

The daily chart insert illustrates gold seasonality for the remainder of 2017.

The Profit Radar Report will continue to monitor technicals, Elliott Wave patterns, sentiment, seasonality and cycles to confirm (or invalidate) our preferred forecast and spot low-risk buy or sell entries.

Simon Maierhofer is the founder of iSPYETF and the publisher of the Profit Radar Report. Barron’s rated iSPYETF as a “trader with a good track record” (click here for Barron’s profile of the Profit Radar Report). The Profit Radar Report presents complex market analysis (S&P 500, Dow Jones, gold, silver, euro and bonds) in an easy format. Technical analysis, sentiment indicators, seasonal patterns and common sense are all wrapped up into two or more easy-to-read weekly updates. All Profit Radar Report recommendations resulted in a 59.51% net gain in 2013, 17.59% in 2014, and 24.52% in 2015.

Follow Simon on Twitter @ iSPYETF or sign up for the FREE iSPYETF Newsletter to get actionable ETF trade ideas delivered for free.


Risk/Reward for Gold and Silver is Getting More Attractive, But …

On May 5, I received the following e-mail:

“Hi Simon, With all this volatility, why don’t you want to initiate any trades? For example a low risk trade as shorting XLU and QQQ? Gold, Silver, Platinum, Natural Gas, Oil look to me as a great long candidates. I don’t understand why you are staying on sidelines at the best time you can trade.”

Here is my reply:

“True, purely based on technicals, there are trades out there, but we lack confirmation of our other indicators to confirm such a trade. I have learned that no trade is better than a bad trade, and that a bad trade is more likely when data is conflicting. We didn’t short QQQ, because of the open chart gap. Feel free to go long gold or silver, and we’ll revisit how that trade is going in a few weeks (please see recent PRRs for more details on why we are not buying silver and gold at these prices). Seasonality for XLU is pretty strong the next several weeks, so shorting it is not ideal.

I’m itching to recommend a trade … once the risk profile improves. Hope this helps a bit. Best, Simon”

I haven’t yet sent an e-mail to revisit the gold and silver trade (I don’t like to rub things in, so I won’t), but lets take a moment to revisit gold and silver.

The April 20 Profit Radar Report looked at technicals, gold sentiment and gold seasonality and concluded the following:

Gold Update

Out of the three driving forces we monitor for gold (technicals, sentiment, seasonality), technicals look the most bullish. Sentiment says risk is elevated. Immediate up side potential is limited based on seasonality.

Important chart support is around 1,200 and 1,160 – 1,130. We are looking to buy gold at a price tag of 1,200 or below. We will reassess our buy limit once (and if) we get closer to 1,200.”

Barron’s rates the iSPYETF as a “trader with a good track record.” Click here for Barron’s assessment of the Profit Radar Report.

The same analysis along with long-term gold and silver charts and sentiment data were also published here on May 5: Gold and Silver Bulls Risk Painful Whipsaw

On Monday, gold fell as low as 1,202, which makes buying much more attractive than it was near 1,300. It now becomes an exercise of patience and fine-tuning to peg the right buy limit.

We may see another up/down sequence before a more ideal low (see chart for potential support levels). The biggest knock against buying right now remains gold sentiment.

Silver

The April 13 Profit Radar Report stated that: “A move above 16.40 could result in a move towards 17.8.”

Silver peaked at 18.075, and the April 24 Profit Radar Report warned that: “Seasonality and sentiment suggest danger ahead. We eventually would like to own silver, but the risk/reward ratio doesn’t become attractive until price drops towards 16 and below.”

Silver fell as low as 15.84 and retraced 50% of the prior gains. There are some oversold readings and silver may bounce, but more bullish sentiment will likely have to be worked off before a more lasting low is reached (see chart for potential support levels).

The corresponding ETF charts for gold and silver – SPDR Gold Shares (NYSEArca: GLD) and iShares Silver Trust (NYSEArca: SLV) – paint the same picture.

Continued gold and silver analysis is available via the Profit Radar Report.

Simon Maierhofer is the founder of iSPYETF and the publisher of the Profit Radar Report. Barron’s rated iSPYETF as a “trader with a good track record” (click here for Barron’s profile of the Profit Radar Report). The Profit Radar Report presents complex market analysis (S&P 500, Dow Jones, gold, silver, euro and bonds) in an easy format. Technical analysis, sentiment indicators, seasonal patterns and common sense are all wrapped up into two or more easy-to-read weekly updates. All Profit Radar Report recommendations resulted in a 59.51% net gain in 2013, 17.59% in 2014, and 24.52% in 2015.

Follow Simon on Twitter @ iSPYETF or sign up for the FREE iSPYETF Newsletter to get actionable ETF trade ideas delivered for free.


Gold and Silver Rally Stalled – What’s Next?

2016 has seen a renaissance for gold and silver. But just as the luster started to return (and investors piled back into the GLD ETF), the rally stalled.

What’s next?

Gold

The March 2 Profit Radar Report identified a triangle and stated:

Upon completion, triangles often lead to strong, but temporary breakouts. A quick spike to 1,300 +/- could mark the end of the initial up leg from the December low. Such a quickly reversed spike higher followed by a multi-week/months correction would harmonize to a satisfactory degree with seasonality and sentiment. A break above 1,255 would be the first steps towards a post-triangle spike.”

The chart below shows the triangle (purple lines) and other resistance levels followed by the Profit Radar Report. There is also a bearish RSI divergence at the latest high.

This explains why gold has fallen since its 1,290 spike high.

A deeper correction, likely followed by another rally leg is likely. Correction low and rally high targets are available via the Profit Radar Report.

Silver

The long-term silver chart (initially published in the February 21 Profit Radar Report) explains why silver is struggling to move higher.

  1. Various technical resistance levels converge around 15.7 – 16.
  2. Commercial hedgers are record bearish.

Commercial hedgers (the smart money) have the highest short exposure since 2008. History (in particular recent history) says this is bad news for silver. The only time commercial hedgers were wrong was late 2010 when silver entered its blow-off stage.

While we anticipate more gains for silver later in 2016, sentiment and seasonality will make it very difficult for silver to rack up further gains in the near future.

It would take a strong catalyst to drive gold/silver prices higher and void bearish sentiment and seasonality. The risk is to the down side for now.

Continuous gold and silver analysis is available via the Profit Radar Report.

Simon Maierhofer is the publisher of the Profit Radar Report. The Profit Radar Report presents complex market analysis (S&P 500, Dow Jones, gold, silver, euro and bonds) in an easy format. Technical analysis, sentiment indicators, seasonal patterns and common sense are all wrapped up into two or more easy-to-read weekly updates. All Profit Radar Report recommendations resulted in a 59.51% net gain in 2013, 17.59% in 2014, and 24.52% in 2015.

Follow Simon on Twitter @ iSPYETF or sign up for the FREE iSPYETF Newsletter to get actionable ETF trade ideas delivered for free.


Gold Seasonality Projects Higher Gold Prices

As far as indicators go, gold seasonality has been on fire.

Gold seasonality projected a top in late January. The January 25 Profit Radar Report warned that: “Gold seasonality is starting to turn sour.”

From January 22 – July 24, gold prices tumbled 17.8%.

The July 19 Profit Radar Report pointed out that: “Seasonality will turn strongly bullish in early August.”

Gold and gold ETFs already soared 6.9% since the August 6 seasonal gold low.

The gold seasonality chart projects further gold gains until early October. This, by the way, does not mean that there won’t be any pullbacks.

Meticulously hand-crafted seasonality charts for all major asset classes are available to subscribers of the Profit Radar Report.

Gold seasonality is only one indicator, but it wasn’t the only indicator suggesting a gold rally. The July 21 article “Gold Looks so Bad, it Might Actually be Good” highlights 3 bullish gold development.

Technical analysis also suggested that a tradable bottom was formed on July 24.

The July 26 Profit Radar Report published the chart below (including the yellow projection) and stated the following: “The daily bar chart shows a bullish reversal candle at Friday’s low. Friday’s intraday reversal satisfies the basic requirements for a tradeable low. As long as Friday’s low (1,075.60) holds, odds favor higher prices with a target above 1,300. We will buy a small amount of gold on a move above 1,100. The equivalent level for SPDR Gold Trust (NYSEArca: GLD is around 105.50.”

Simon Maierhofer is the publisher of the Profit Radar Report. The Profit Radar Report presents complex market analysis (S&P 500, Dow Jones, gold, silver, euro and bonds) in an easy format. Technical analysis, sentiment indicators, seasonal patterns and common sense are all wrapped up into two or more easy-to-read weekly updates. All Profit Radar Report recommendations resulted in a 59.51% net gain in 2013 and 17.59% in 2014.

Follow Simon on Twitter @ iSPYETF or sign up for the FREE iSPYETF Newsletter to get actionable ETF trade ideas delivered for free.

If you enjoy quality, hand-crafted research, >> Sign up for the FREE iSPYETF Newsletter

Gold Seasonality and Sentiment Turned Frosty

In early November, gold finally reached my down side target and I became a self-proclaimed gold bull, at least for 2015.

After over three years of falling prices (from 1,927 to 1,130) it just felt right to put the bear down for its hibernation and become a bull. In November 2014, at the 1,130 low, the pieces were in place for at least a tradable and perhaps a lasting low:

  1. Gold reached my down side target
  2. There was a bullish RSI divergence
  3. There was a big green reversal candle at the November 7 low
  4. Seasonality was turning temporarily bullish
  5. Sentiment was ripe for a reversal. The ‘smart money’ was bullish and the ‘dumb money’ was bearish

On queue, gold started cruising higher and everything went according to plan … until something odd happened in late January.


The January 27 Profit Radar Report noted that commercial traders (smart money) were selling gold at a rapid pace, and published the chart below. The dashed red lines illustrate what happened the last two times commercial traders fled gold.

The chart also included Elliott Wave labels (numbers from 1 – 5). In case you’re not familiar with Elliott Wave Theory, you may find this excerpt from the same Profit Radar Report interesting:

The chart shows that current trade is important from an Elliot Wave perspective. Gold appears to have completed a 3 wave rally. There are now two options:

  1. Gold will trace out a wave 4 correction followed by wave 5 higher. Target for a wave 5 high is around 1,330.

    Longer-term, a complete 5-wave rally will be followed by a corrective decline and at least one more rally leg.

    Shorter-term, a wave 4 correction could become a pain to manage. Waves 4 tend to seesaw over support/resistance levels, therefore using the trend channel support at 1,275 as stop loss could kick us out at the wrong time.

  2. A 3-wave rally is indicative of a correction and would translate into a relapse to new lows. This option is unlikely, but theoretically possible.”

Balancing the potential of long-term gains and short-term risk was a tough call, but my recommendation was as follows:

We can either take our profits and run or commit to endure a potentially painful correction in exchange for further gains. I like to keep things simple and recommend taking profits. Lets cash in gold around 1,295 and GLD around 124.20 for a nice 13.5% gain.”

In addition to bearish sentiment developments, the Profit Radar Report cautioned of weak gold seasonality. The chart below plots the actual price of the SPDR Gold Shares ETF (NYSEArca: GLD) against gold seasonality up until mid-March (a full year gold seasonality chart is available to subscribers of the Profit Radar Report).

It’s hard to ignore the textbook November bottom, but it’s also hard to ignore the January sentiment and seasonality warnings. The risk of more down side is real, and my inner gold bull is set on hibernation mode for now. As per the second Elliott Wave Theory option discussed above, new lows are at least possible.

Simon Maierhofer is the publisher of the Profit Radar Report. The Profit Radar Report presents complex market analysis (S&P 500, Dow Jones, gold, silver, euro and bonds) in an easy format. Technical analysis, sentiment indicators, seasonal patterns and common sense are all wrapped up into two or more easy-to-read weekly updates. All Profit Radar Report recommendations resulted in a 59.51% net gain in 2013 and 17.59% in 2014.

Follow Simon on Twitter @ iSPYETF or sign up for the FREE iSPYETF Newsletter to get actionable ETF trade ideas delivered for free.

Is Gold Rolling Over Again?

I published the chart with the two CNBC headlines in the January 19 Profit Radar Report. It just illustrates nicely how the change of price affects sentiment and vice versa. A risk trend followers hate and contrarian investors love.

We bought gold at 1,140 (as per the November 5 Profit Radar Report recommendation) when no one wanted to own it.

Now, it’s more fashionable to own the yellow metal again.

This alone is reason to be cautious, but it’s not the only one.

The gold seasonality chart below, featured in the January 25 Profit Radar Report, shows that seasonality soured around January 22.

Although it’s a couple of days old, the assessment published in the January 27 Profit Radar Report is still fully applicable.

The easy money in the gold trade has been made. More attention and mental stamina is required now. Sunday’s PRR showed seasonality is turning bearish. Commercial traders (‘smart money’) have further reduced exposure.

The chart shows that current trade is important from an Elliot Wave perspective. Gold appears to have completed a 3 wave rally. There are now two options:

Gold will trace out a wave 4 correction followed by wave 5 higher. Target for a wave 5 high is around 1,xxx (reserved for subscribers of the Profit Radar Report).

Longer-term, a complete 5-wave rally will be followed by a corrective decline and at least one more rally leg.

Shorter-term, a wave 4 correction could become a pain to manage. Waves 4 tend to seesaw over support/resistance levels, therefore using the trend channel support at 1,275 as stop loss could kick us out at the wrong time.

A 3-wave rally is indicative of a correction and would translate into a relapse to new lows. This option is unlikely, but theoretically possible.

We can either take our profits and run or commit to endure a potentially painful correction in exchange for further gains. I like to keep things simple and recommend taking profits. Lets cash in gold around 1,295 and GLD around 124.20 for a nice 13.5% gain.”

Gold has since dropped to 1,255. The SPDR Gold Shares (NYSEArca: GLD, iShares Gold Trust (NYSEArca: IAU) and Market Vectors Gold Minders ETF (NYSEArca: GDX) also peeled away from their recovery highs. I still think gold, GLD and IAU will see higher highs, but it will take some patience to get there.

Simon Maierhofer is the publisher of the Profit Radar Report. The Profit Radar Report presents complex market analysis (S&P 500, Dow Jones, gold, silver, euro and bonds) in an easy format. Technical analysis, sentiment indicators, seasonal patterns and common sense are all wrapped up into two or more easy-to-read weekly updates. All Profit Radar Report recommendations resulted in a 59.51% net gain in 2013 and 17.59%.

Follow Simon on Twitter @ iSPYETF or sign up for the FREE iSPYETF Newsletter to get actionable ETF trade ideas delivered for free.

Once Largest ETF in the World Drops Out of Top 10

At one point in history, the SPDR Gold Shares (NYSEArca: GLD) was the world’s largest ETF.

Courtesy of a massive gold bull market and the accompanying hysteria, GLD’s assets mushroomed to $77.5 billion. That was in August 2011.

Back than, the S&P 500 traded around 1,100. Gold traded near 1,900. How the roles have reversed (Gold at 1,100, S&P at 2,050).

The SPDR S&P 500 ETF (NYSEArca: SPY) is now $205 billion strong, while GLD amounts to ‘only’ $27 billion, the 12th largest ETF in the world.

This data may be of some use to contrarians on gold bugs.

In fact, back in December 2013 I used official data from iShares and State Street on the SPDR Gold Shares, iShares Gold Trust (NYSEArca: IAU) and iShares Silver Trust (NYSEArca: SLV) for very insightful sentiment analysis.

The data (tons of gold/silver held, and trading volume) helped me come to the conclusion that gold and silver were still miles away from a major low (view original  SLV analysis or GLD analysis).

Unfortunately iShares does not offer that data anymore (I send an e-mail every month to bug them, but it hasn’t helped).

Other sentiment data and technical analysis triggered a buy signal (sent to subscribers of the Profit Radar Report) for gold in November 2014 at 1,140 (111 for GLD).

We’ve been holding on ever since, but gold needs to surpass strong overhead resistance to give the preferred bullish scenario some teeth.

The fact that GLD has fallen out of favor with investors is a check mark on the bullish side of the ledger.

Simon Maierhofer is the publisher of the Profit Radar Report. The Profit Radar Report presents complex market analysis (S&P 500, Dow Jones, gold, silver, euro and bonds) in an easy format. Technical analysis, sentiment indicators, seasonal patterns and common sense are all wrapped up into two or more easy-to-read weekly updates. All Profit Radar Report recommendations resulted in a 59.51% net gain in 2013.

Follow Simon on Twitter @ iSPYETF or sign up for the FREE iSPYETF Newsletter to get actionable ETF trade ideas delivered for free.