Gold Tug-of War: Mid-term Bullish vs Short-term Bearish

Gold has been zigzagging up and down for all of 2017. This erratic performance brings a measure of uncertainty, but – in a way – it also increases confidence in our long-term forecast.

Starting in November 2015, the Profit Radar Report expected a sizeable gold rally.

The November 30, 2015 Profit Radar Report published the chart below, which shows gold at quadruple support and record bullish smart money hedgers. An ideal setup for a rally (gold’s final low occurred on December 3, 2015 at 1,045).

The second chart shows the Elliott Wave Theory (EWT) labeling we’ve been following for the past years.

According to EWT, the first wave (comprised of five sub-waves) of the bear market ended in December 2015. The rally since is a counter trend move.

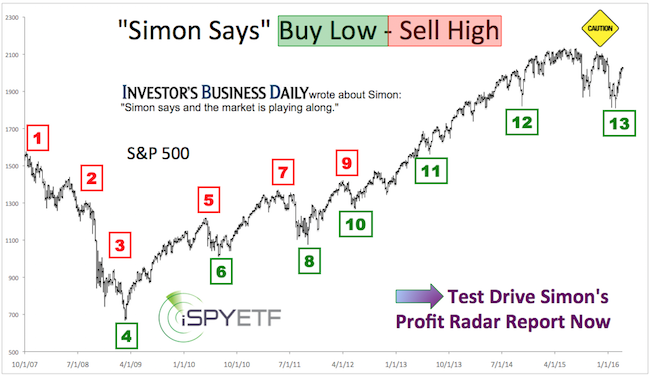
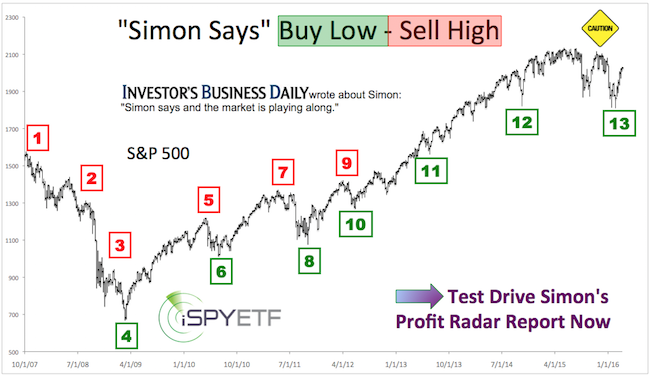
Barron’s rates iSPYETF as “trader with a good track record” and Investor’s Bussines Daily says “When Simon says, the market listens.”

Common Fibonacci target levels for this counter trend rally are 1,381, 1,485 and 1,588. Counter trends are generally more choppy and less predictable, which is true of the rally from December 2015 to September 2017 (this increases confidence in our forecast).

Since we were looking for a move above 1,382, the Profit Radar Report issued a buy signal for gold and gold ETFs like the SPDR Gold Shares (GLD) in November 2015 (gold at 1,088), and in August 2017 (gold at 1282).

On September 8, 2017 gold became overbought and touched the top of the black trend channel. Smart money hedgers (which were record bullish at the December 2015 low) turned significantly more bearish (see daily chart).

For those reasons, the Profit Radar Report issued a sell signal on September 5, 2017.

We don’t have a down side target for the current pullback (yet), but the lack of a bearish RSI-divergence at the September 8 high and failure to reach or exceed Fibonacci resistance at 1,381 suggests gold will take another stab at new recovery highs.

The daily chart insert illustrates gold seasonality for the remainder of 2017.

The Profit Radar Report will continue to monitor technicals, Elliott Wave patterns, sentiment, seasonality and cycles to confirm (or invalidate) our preferred forecast and spot low-risk buy or sell entries.

Simon Maierhofer is the founder of iSPYETF and the publisher of the Profit Radar Report. Barron’s rated iSPYETF as a “trader with a good track record” (click here for Barron’s profile of the Profit Radar Report). The Profit Radar Report presents complex market analysis (S&P 500, Dow Jones, gold, silver, euro and bonds) in an easy format. Technical analysis, sentiment indicators, seasonal patterns and common sense are all wrapped up into two or more easy-to-read weekly updates. All Profit Radar Report recommendations resulted in a 59.51% net gain in 2013, 17.59% in 2014, and 24.52% in 2015.

Follow Simon on Twitter @ iSPYETF or sign up for the FREE iSPYETF Newsletter to get actionable ETF trade ideas delivered for free.
 

Risk/Reward for Gold and Silver is Getting More Attractive, But …

On May 5, I received the following e-mail:

“Hi Simon, With all this volatility, why don’t you want to initiate any trades? For example a low risk trade as shorting XLU and QQQ? Gold, Silver, Platinum, Natural Gas, Oil look to me as a great long candidates. I don’t understand why you are staying on sidelines at the best time you can trade.”

Here is my reply:

“True, purely based on technicals, there are trades out there, but we lack confirmation of our other indicators to confirm such a trade. I have learned that no trade is better than a bad trade, and that a bad trade is more likely when data is conflicting. We didn’t short QQQ, because of the open chart gap. Feel free to go long gold or silver, and we’ll revisit how that trade is going in a few weeks (please see recent PRRs for more details on why we are not buying silver and gold at these prices). Seasonality for XLU is pretty strong the next several weeks, so shorting it is not ideal.

I’m itching to recommend a trade … once the risk profile improves. Hope this helps a bit. Best, Simon”

I haven’t yet sent an e-mail to revisit the gold and silver trade (I don’t like to rub things in, so I won’t), but lets take a moment to revisit gold and silver.

The April 20 Profit Radar Report looked at technicals, gold sentiment and gold seasonality and concluded the following:

Gold Update

Out of the three driving forces we monitor for gold (technicals, sentiment, seasonality), technicals look the most bullish. Sentiment says risk is elevated. Immediate up side potential is limited based on seasonality.

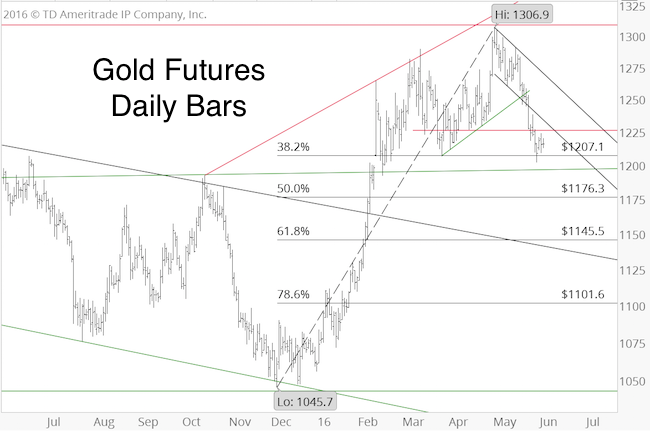
Important chart support is around 1,200 and 1,160 – 1,130. We are looking to buy gold at a price tag of 1,200 or below. We will reassess our buy limit once (and if) we get closer to 1,200.”

Barron’s rates the iSPYETF as a “trader with a good track record.” Click here for Barron’s assessment of the Profit Radar Report.

The same analysis along with long-term gold and silver charts and sentiment data were also published here on May 5: Gold and Silver Bulls Risk Painful Whipsaw

On Monday, gold fell as low as 1,202, which makes buying much more attractive than it was near 1,300. It now becomes an exercise of patience and fine-tuning to peg the right buy limit.

We may see another up/down sequence before a more ideal low (see chart for potential support levels). The biggest knock against buying right now remains gold sentiment.

Silver

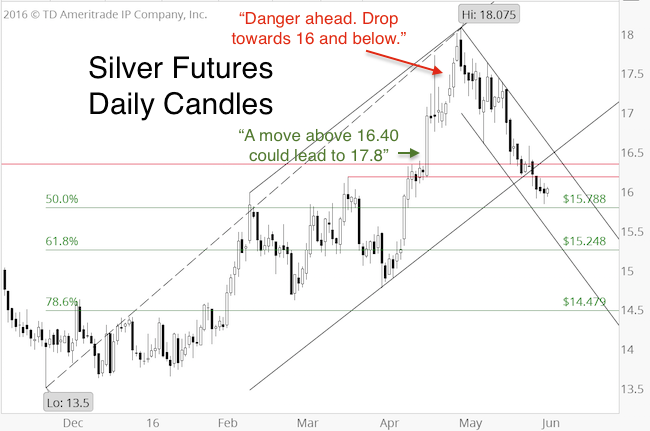
The April 13 Profit Radar Report stated that: “A move above 16.40 could result in a move towards 17.8.”

Silver peaked at 18.075, and the April 24 Profit Radar Report warned that: “Seasonality and sentiment suggest danger ahead. We eventually would like to own silver, but the risk/reward ratio doesn’t become attractive until price drops towards 16 and below.”

Silver fell as low as 15.84 and retraced 50% of the prior gains. There are some oversold readings and silver may bounce, but more bullish sentiment will likely have to be worked off before a more lasting low is reached (see chart for potential support levels).

The corresponding ETF charts for gold and silver – SPDR Gold Shares (NYSEArca: GLD) and iShares Silver Trust (NYSEArca: SLV) – paint the same picture.

Continued gold and silver analysis is available via the Profit Radar Report.

Simon Maierhofer is the founder of iSPYETF and the publisher of the Profit Radar Report. Barron’s rated iSPYETF as a “trader with a good track record” (click here for Barron’s profile of the Profit Radar Report). The Profit Radar Report presents complex market analysis (S&P 500, Dow Jones, gold, silver, euro and bonds) in an easy format. Technical analysis, sentiment indicators, seasonal patterns and common sense are all wrapped up into two or more easy-to-read weekly updates. All Profit Radar Report recommendations resulted in a 59.51% net gain in 2013, 17.59% in 2014, and 24.52% in 2015.

Follow Simon on Twitter @ iSPYETF or sign up for the FREE iSPYETF Newsletter to get actionable ETF trade ideas delivered for free.
 

Gold Seasonality Projects Higher Gold Prices

As far as indicators go, gold seasonality has been on fire.

Gold seasonality projected a top in late January. The January 25 Profit Radar Report warned that: “Gold seasonality is starting to turn sour.”

From January 22 – July 24, gold prices tumbled 17.8%.

The July 19 Profit Radar Report pointed out that: “Seasonality will turn strongly bullish in early August.”

Gold and gold ETFs already soared 6.9% since the August 6 seasonal gold low.

The gold seasonality chart projects further gold gains until early October. This, by the way, does not mean that there won’t be any pullbacks.

Meticulously hand-crafted seasonality charts for all major asset classes are available to subscribers of the Profit Radar Report.

Gold seasonality is only one indicator, but it wasn’t the only indicator suggesting a gold rally. The July 21 article “Gold Looks so Bad, it Might Actually be Good” highlights 3 bullish gold development.

Technical analysis also suggested that a tradable bottom was formed on July 24.

The July 26 Profit Radar Report published the chart below (including the yellow projection) and stated the following: “The daily bar chart shows a bullish reversal candle at Friday’s low. Friday’s intraday reversal satisfies the basic requirements for a tradeable low. As long as Friday’s low (1,075.60) holds, odds favor higher prices with a target above 1,300. We will buy a small amount of gold on a move above 1,100. The equivalent level for SPDR Gold Trust (NYSEArca: GLD is around 105.50.”

Simon Maierhofer is the publisher of the Profit Radar Report. The Profit Radar Report presents complex market analysis (S&P 500, Dow Jones, gold, silver, euro and bonds) in an easy format. Technical analysis, sentiment indicators, seasonal patterns and common sense are all wrapped up into two or more easy-to-read weekly updates. All Profit Radar Report recommendations resulted in a 59.51% net gain in 2013 and 17.59% in 2014.

Follow Simon on Twitter @ iSPYETF or sign up for the FREE iSPYETF Newsletter to get actionable ETF trade ideas delivered for free.
If you enjoy quality, hand-crafted research, >> Sign up for the FREE iSPYETF Newsletter

Is Gold Rolling Over Again?

I published the chart with the two CNBC headlines in the January 19 Profit Radar Report. It just illustrates nicely how the change of price affects sentiment and vice versa. A risk trend followers hate and contrarian investors love.

We bought gold at 1,140 (as per the November 5 Profit Radar Report recommendation) when no one wanted to own it.

Now, it’s more fashionable to own the yellow metal again.

This alone is reason to be cautious, but it’s not the only one.

The gold seasonality chart below, featured in the January 25 Profit Radar Report, shows that seasonality soured around January 22.

Although it’s a couple of days old, the assessment published in the January 27 Profit Radar Report is still fully applicable.

The easy money in the gold trade has been made. More attention and mental stamina is required now. Sunday’s PRR showed seasonality is turning bearish. Commercial traders (‘smart money’) have further reduced exposure.

The chart shows that current trade is important from an Elliot Wave perspective. Gold appears to have completed a 3 wave rally. There are now two options:

Gold will trace out a wave 4 correction followed by wave 5 higher. Target for a wave 5 high is around 1,xxx (reserved for subscribers of the Profit Radar Report).

Longer-term, a complete 5-wave rally will be followed by a corrective decline and at least one more rally leg.

Shorter-term, a wave 4 correction could become a pain to manage. Waves 4 tend to seesaw over support/resistance levels, therefore using the trend channel support at 1,275 as stop loss could kick us out at the wrong time.

A 3-wave rally is indicative of a correction and would translate into a relapse to new lows. This option is unlikely, but theoretically possible.

We can either take our profits and run or commit to endure a potentially painful correction in exchange for further gains. I like to keep things simple and recommend taking profits. Lets cash in gold around 1,295 and GLD around 124.20 for a nice 13.5% gain.”

Gold has since dropped to 1,255. The SPDR Gold Shares (NYSEArca: GLD, iShares Gold Trust (NYSEArca: IAU) and Market Vectors Gold Minders ETF (NYSEArca: GDX) also peeled away from their recovery highs. I still think gold, GLD and IAU will see higher highs, but it will take some patience to get there.

Simon Maierhofer is the publisher of the Profit Radar Report. The Profit Radar Report presents complex market analysis (S&P 500, Dow Jones, gold, silver, euro and bonds) in an easy format. Technical analysis, sentiment indicators, seasonal patterns and common sense are all wrapped up into two or more easy-to-read weekly updates. All Profit Radar Report recommendations resulted in a 59.51% net gain in 2013 and 17.59%.

Follow Simon on Twitter @ iSPYETF or sign up for the FREE iSPYETF Newsletter to get actionable ETF trade ideas delivered for free.
Once Largest ETF in the World Drops Out of Top 10

At one point in history, the SPDR Gold Shares (NYSEArca: GLD) was the world’s largest ETF.

Courtesy of a massive gold bull market and the accompanying hysteria, GLD’s assets mushroomed to $77.5 billion. That was in August 2011.

Back than, the S&P 500 traded around 1,100. Gold traded near 1,900. How the roles have reversed (Gold at 1,100, S&P at 2,050).

The SPDR S&P 500 ETF (NYSEArca: SPY) is now $205 billion strong, while GLD amounts to ‘only’ $27 billion, the 12th largest ETF in the world.

This data may be of some use to contrarians on gold bugs.

In fact, back in December 2013 I used official data from iShares and State Street on the SPDR Gold Shares, iShares Gold Trust (NYSEArca: IAU) and iShares Silver Trust (NYSEArca: SLV) for very insightful sentiment analysis.

The data (tons of gold/silver held, and trading volume) helped me come to the conclusion that gold and silver were still miles away from a major low (view original  SLV analysis or GLD analysis).

Unfortunately iShares does not offer that data anymore (I send an e-mail every month to bug them, but it hasn’t helped).

Other sentiment data and technical analysis triggered a buy signal (sent to subscribers of the Profit Radar Report) for gold in November 2014 at 1,140 (111 for GLD).

We’ve been holding on ever since, but gold needs to surpass strong overhead resistance to give the preferred bullish scenario some teeth.

The fact that GLD has fallen out of favor with investors is a check mark on the bullish side of the ledger.

Simon Maierhofer is the publisher of the Profit Radar Report. The Profit Radar Report presents complex market analysis (S&P 500, Dow Jones, gold, silver, euro and bonds) in an easy format. Technical analysis, sentiment indicators, seasonal patterns and common sense are all wrapped up into two or more easy-to-read weekly updates. All Profit Radar Report recommendations resulted in a 59.51% net gain in 2013.

Follow Simon on Twitter @ iSPYETF or sign up for the FREE iSPYETF Newsletter to get actionable ETF trade ideas delivered for free.

Simon Says: 3 Most Contrarian ETFs to Own Right Now

Here are three contrarian picks for die-hard contrarians and those who missed the latest stock market rally. Two trades are true bottom pickers, one trade is 2x contrarian, which almost makes it a mainstream trade.

If contrarian investing came with a label, it might as well be ‘no guts, no glory.’ It takes guts to bet against the crowd, but it can pay off big.

I use sophisticated software and crosscheck with basic media sentiment (headlines) to identify extreme sentiment delights for contrarians. Here are my top three choices:

Gold Anyone?

Gold prices have dropped almost $800 since September 2011, and according to many pros, gold will shed another $300 – $400. Here are a few recent doom and gloom headlines:

  • “A final purge to $700? What gold bulls surrender might look like” – Nov. 12
  • “Here’s why gold could be headed to $800” – Nov. 12
  • “Gold bulls beware: More pain coming” – Nov. 10

If gold is going to drop another few hundred bugs, why would anyone hold on to it? That’s the crux of contrarian investing. In the midst of extreme pessimism, there are not enough sellers left to drive prices much lower.

It appears that gold is at or near this point, often called the ‘puke point’. Gold ETFs like the SPDR Gold Shares (NYSEArca: GLD) and iShares Silver Trust (NYSEArca: IAU) are likely to surprise many to the up side.

Fill up The Car Honey

According to the U.S. Energy Department, low gas prices aren’t going away anytime soon. I don’t recall the Energy Dept predicting a 30% drop a few months ago, but that’s what happened.

According to one ‘pro’ interviewed on CNBC, gas may drop to $30.

Catching a bottom in oil prices is a bit like catching the proverbial falling knife, but simply based on investor/media sentiment, this slippery, oily knife is closer to the kitchen floor (a bottom) than the hand that dropped it (top).

The United States Oil Fund (NYSEArca: USO) and Energy Select Sector SPDRs (NYSEArca: XLE) are two ways to play a bounce.

The Ultimate 2x Contrarian Trade?

Back in May I noticed, and reported on, the unusual amount of bearish media coverage. Russ Koesterich (chief investment strategist at BlackRock), Wilbur Ross (billionaire investor), Carl Icahn (billionaire investor), David Tepper, Marc Faber and Peter Schiff predicted a serious correction or outright market crash.

In the spirit of no guts, no glory, I wrote back then: “Here’s a message for everyone vying to be the next Roubini: A watched pot doesn’t boil and a watched bubble doesn’t burst.”

Some of the recent headlines make we wonder if we’re in for a May/June repeat:

  • “Sentiment is ‘off the charts’ bullish” – Nov. 12
  • “Don’t get suckered by stock market winning streak” – Nov. 12
  • “Marc ‘Dr Doom’ Faber: I will soon be proven right” – Nov. 13

Yes, sentiment polls show excess optimism, but can it still be considered a contrarian indicator if everyone reads about it? Will two negatives make a positive?

Another factor to keep in mind is that actual money flow indicators do not confirm sentiment polls. Investors don’t seem to be putting their money where their mouth is.

Therefore, owning stocks into next year may be more of a true contrarian move than selling stocks. Instead of owning broad market ETFs like the S&P 500 SPDRs (NYSEArca: SPY), I would probably opt for certain sector ETFs that offer more up side.

Simon Maierhofer is the publisher of the Profit Radar Report. The Profit Radar Report presents complex market analysis (S&P 500, Dow Jones, gold, silver, euro and bonds) in an easy format. Technical analysis, sentiment indicators, seasonal patterns and common sense are all wrapped up into two or more easy-to-read weekly updates. All Profit Radar Report recommendations resulted in a 59.51% net gain in 2013.

Follow Simon on Twitter @ iSPYETF or sign up for the FREE iSPYETF Newsletter to get actionable ETF trade ideas delivered for free.

Will the Absence of QE Continue to Melt Gold?

The Fed just announced that sterilized QE is over, done, toast. Gold prices have crashed, slicing through a 15-month support shelf like a knife through butter. But, are QE and gold really connected? This chart shows the surprising truth.

Here are two facts (most investors will say they are not random):

  1. QE is over.
  2. Gold is crashing.

Here is a key question:

Is gold crashing because QE is over?

To get the answer, we’ll do two things: 1) Rewind and 2) Reason.

Rewind Time to 2008

Gold’s last big bull market leg started in October 2008, right after the Federal Reserve unleashed QE1.

Investors feared inflation due to the massive liquidity influx. Gold was considered as the default inflation hedge and prices soared from $680/oz to $1,900/oz.

At first glance it seems like QE1 buoyed gold. The inverse conclusion is that the end of QE may well sink gold.

Reason & Facts

During QE1, gold prices, and gold ETFs like the SPDR Gold Shares (NYSEArca: GLD), gained 34%.

QE2 lifted GLD by 10%.

But, and that’s a big but, throughout QE3/QE4 GLD lost 32%.

The chart below plots GLD against a visual description of QE1 – QE4. QE3 and QE4 are lumped into one graph (light green) to illustrate the combined effect of both programs.

QE3 started when gold was still trading near $1,800/oz ($175 for GLD). It’s been down hill ever since.

Gold rallied during QE1 and QE2 and declined during QE3 and QE4. Statistically, the evidence shows a 50% chance that QE may or may not have affected gold prices.

I realize that there are other factors in play, but one takeaway from this chart is that the absence of QE in itself is not necessarily terrible for gold and GLD.

More Facts

The December 29, 2013 Profit Radar Report featured the following gold forecast for the year ahead:

Gold prices have steadily declined since November, but we haven’t seen a capitulation sell off yet. Capitulation is generally the last phase of a bear market. It flushes out weak hands. Prices can’t stage a lasting rally as long as weak hands continue to sell every bounce.

Gold sentiment is very bearish (bullish for gold) and prices may bounce from here. However, without prior capitulation, any rally is built on a shaky foundation and unlikely to spark a new bull market.

We would like to see a new low (below the June low at 1,178). There’s support at 1,162 – 1,155 and 1,028 – 992. Depending on the structure of any decline, we would evaluate if it makes sense to buy around 1,160 or if a drop to 1,000 +/- is more likely.”

Obviously much has happened since December 29, and the levels mentioned back then may need some tweaking. Nevertheless, gold has fallen below 1,178 and is trading near the 1,155 support level.

In addition, gold sentiment has soured quite a bit. Two recent CNBC articles expected gold prices to drop below $1,000 and trade at $800 next year.

The Commitment of Traders report shows increased pessimism, but not historically extreme pessimism.

The chewed out adage that fishing for a bottom is like catching a falling knife obviously applies to anyone looking to buy gold.

But based on a composite analysis of fundamentals, sentiment and price action, the falling golden knife is closer to the kitchen floor than the hand that dropped it.

The latest Profit Radar Report includes a detailed strategy on how to buy gold with minimum risk and maximum rewards.

Simon Maierhofer is the publisher of the Profit Radar Report. The Profit Radar Report presents complex market analysis (S&P 500, Dow Jones, gold, silver, euro and bonds) in an easy format. Technical analysis, sentiment indicators, seasonal patterns and common sense are all wrapped up into two or more easy-to-read weekly updates. All Profit Radar Report recommendations resulted in a 59.51% net gain in 2013.

Follow Simon on Twitter @ iSPYETF or sign up for the FREE iSPYETF Newsletter to get actionable ETF trade ideas delivered for free.

Smart Money is Leaving Gold Just as the ‘Herd’ is Jumping in

From June 2 to July 10 gold prices surged 8.7%. Commercial traders were the first to get in on this rally and the first to get out. While commercials pulled out, the ‘herd’ (or dumb money) piled in. Could this be a significant gold high?

The greater fool theory may just be playing out in the gold market.

Commercial traders (often considered the ‘smart money’) have been pulling money out of gold while investors and speculators (often considered the ‘dumb money) are piling into gold and gold ETFs.

The most popular gold ETFs are the SPDR Gold Shares (NYSEArca: GLD) and iShares Gold Trust (NYSEArca: IAU).

The chart below plots the SPDR Gold Shares against the futures positions of commercial traders (Commitment of Traders report).

Commercials’ exposure to gold futures just dropped to the lower level since October 2012. This marked the onset of a nasty decline that accelerated in March 2013, the only other time commercials really scaled down their exposure (red lines).

Partially based on investor sentiment, the June 13 Profit Radar Report recommended to short gold (unfortunately, our sell stop was not quite triggered).

Various media outlets linked this week’s gold (and GLD, IAU) selloff with Yellen’s comments about inflation.

Those comments may have contributed to gold’s $50 drop, but it can’t be the only reason. If it were, it would imply that commercial gold traders (which started selling gold weeks ago) could actually read Yellen’s mind.

Is there another reason why gold prices sold off? Yes there is.

In fact, based on a combination of factors, the June 1 Profit Radar Report projected a gold rally to around 1,350 followed by a steep reversal.

The actual price projections, the reasons for the projection, and what’s next is discussed here:

Gold Chart at the Cusp of Breaking Down

Simon Maierhofer is the publisher of the Profit Radar Report. The Profit Radar Report presents complex market analysis (S&P 500, Dow Jones, gold, silver, euro and bonds) in an easy format. Technical analysis, sentiment indicators, seasonal patterns and common sense are all wrapped up into two or more easy-to-read weekly updates. All Profit Radar Report recommendations resulted in a 59.51% net gain in 2013.

Follow Simon on Twitter @ iSPYETF or sign up for the FREE iSPYETF Newsletter to get actionable ETF trade ideas delivered for free.

Why 2014’s Biggest Gold Rally May be Bearish for S&P 500

Gold just saw its biggest one-day gain of the year. At the same time the S&P 500 climbed to yet another 1-year high. Since 2009, this constellation happened three times, and led to short-term S&P 500 weakness every time.

Gold jumped 3.26% on Thursday, the biggest one-day gain of 2014. Ironically, such a display of gold’s strength is short-term bearish for the S&P 500.

Since the beginning of the post-2009 QE bull market, there’ve been three prior occasions when gold staged the biggest move of the past six months, while the S&P 500 (SNP: ^GSPC) traded at new 1-year highs.

All three instances are illustrated via the charts below:

November 4, 2010:
S&P 500 pulled back immediately.
Gold staged a minor pullback a few days later before moving higher.

July 22, 2013:
S&P 500 grinded higher for a few more days before a multi-week correction.
Gold meandered sideways/down.

September 18, 2013:
S&P 500 and gold pulled back immediately.

Gold’s performance is in line with what the Profit Radar Report proposed on May 28: “Gold broke out of the triangle and is approaching a general support zone at 1,255 – 1,230. A bounce from this zone to about 1,330 is quite possible.”

Thus far in June, gold bounced from 1,238 to 1,322.

Based on gold seasonality a bottom for gold may be in. But gold cycles and the lack of a real washout selloff suggest another new low.

Silver cycles are a bit more bullish than gold, that’s why the June 15 Profit Radar Report recommended to buy silver at 19.6 (silver spiked as high as 20.1 today).

Summary

Gold is getting closer to its initial up side target around 1,330 and the S&P 500 is at the up side target (1,954) projected by the Profit Radar Report back in January.

It’s too early to panic sell, but risk for gold and gold ETFs like the SPDR Gold Shares (NYSEArca: GLD) and the S&P 500 (NYSEArca: SPY) is rising.

Why is S&P 1,954 so important? Here’s why the Profit Radar Report pegged 1,954 back on January 15, 2014.

2014 S&P 500 Forecast

Simon Maierhofer is the publisher of the Profit Radar Report. The Profit Radar Report presents complex market analysis (S&P 500, Dow Jones, gold, silver, euro and bonds) in an easy format. Technical analysis, sentiment indicators, seasonal patterns and common sense are all wrapped up into two or more easy-to-read weekly updates. All Profit Radar Report recommendations resulted in a 59.51% net gain in 2013.

Follow Simon on Twitter @ iSPYETF or sign up for the FREE iSPYETF Newsletter to get actionable ETF trade ideas delivered for free.

Short-Term Technical Analysis for Gold

Gold is at one of those potential key juncture where technical analysis can really enhance the message of investor sentiment. Excessive optimism suggests some trouble ahead. Technical analysis for gold can help pinpoint when.

On February 7 gold prices exceeded trend line resistance (dashed red line) that capped every prior breakout attempt.

The breakout is highlighted by the blue oval.

On February 9, the Profit Radar Report stated that: “Gold is chipping away at trend line resistance. The odds now favor a spike higher as long as there’s no close below 1,254. Key resistance and possible near-term target is at the descending trend line/trend channel resistance around 1,340.”

The February 17 Profit Radar Report refined the up side target: “Ultimately gold may move higher towards 1,360 or even 1,400.”

Gold is close to the up side target and the March 16 Profit Radar Report warned of excessive optimism, so there are a few things worth considering:

1) On March 14 gold closed at a new recovery high. This recovery high was confirmed by RSI (yellow line), which is generally considered bullish.

However, prior highs (August and October 2013) were also accompanied by a new RSI high and didn’t prevent further declines.

2) On March 17 gold touched the upper side of an ‘old’ trend channel and reversed (gray circle).

3) Tuesday’s decline triggered a ‘bullish percentR low-risk entry (pink circle). The initial drop of percentR below the 80 line (pink oval) is generally considered an opportunity to buy as long as trade doesn’t close below that day’s low (1,351). The corresponding ‘failure level’ for the SDPR Gold Shares (NYSEArca: GLD) is 130.33, for the iShares Gold Trust (NYSEArca: IAU) 13.11.

A close below 1,351 will be a failed bullish low-risk entry. Over the past year, every failed low-risk entry resulted in further losses.

It may be too early to bury this gold rally (there is still a possible higher target – see March 16 Profit Radar Report), but sentiment strongly suggests that the next bigger surprise will be to the down side.

Here is a piece of gold (and GLD, IAU) sentiment analysis that may surprise you and put a smirk on your face at the same time.

Gold Rally – New Bull Market or Bull Trap?

Simon Maierhofer is the publisher of the Profit Radar Report. The Profit Radar Report presents complex market analysis (S&P 500, Dow Jones, gold, silver, euro and bonds) in an easy format. Technical analysis, sentiment indicators, seasonal patterns and common sense are all wrapped up into two or more easy-to-read weekly updates. All Profit Radar Report recommendations resulted in a 59.51% net gain in 2013.

Follow Simon on Twitter @ iSPYETF or sign up for the FREE iSPYETF Newsletter to get actionable ETF trade ideas delivered for free.